NChart3D Tutorial
Introduction
In this tutorial, you will learn how to create a basic chart for an XR immersive mode of visionOS using the NChart3D library. The API of NChart3D for visionOS is almost the same as the API of NChart3D for iOS. So, you may want to check out this tutorial as well, because it covers the main concepts and explains the chart’s anatomy. But if you’re eager to start with visionOS here and now, though you are new to NChart3D, just keep going through this tutorial. It will explain all the basics whenever they pop up.
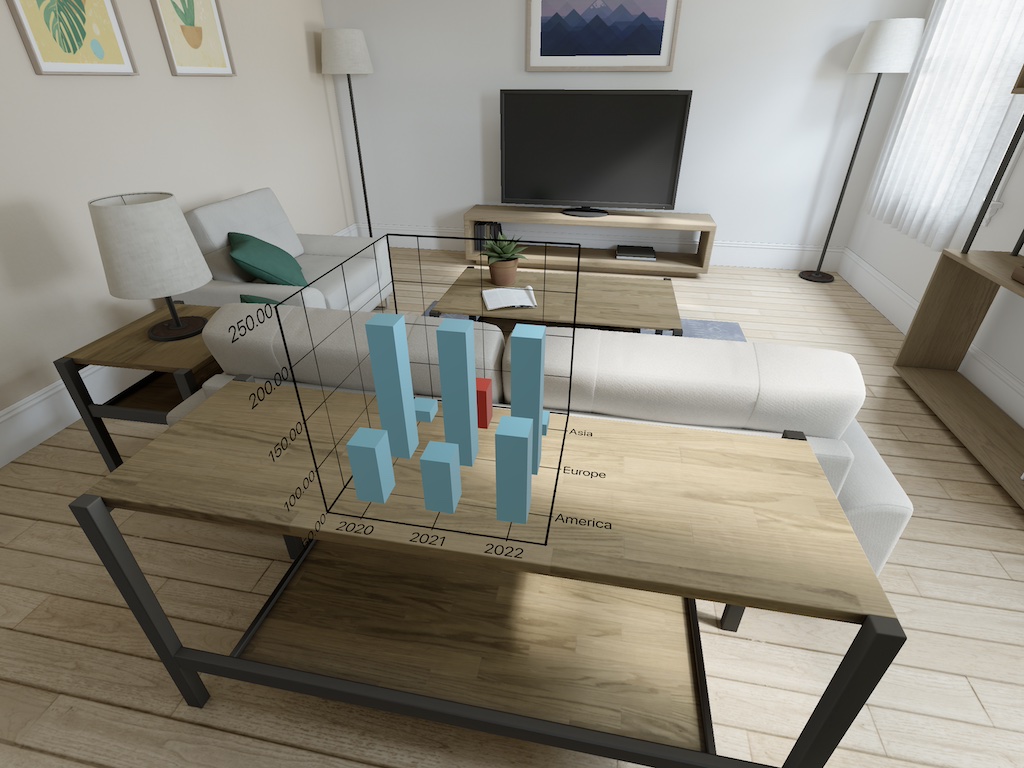
In the end, this is what you should get:
Preparing the data
Before starting the visualisation, you should have your data.
Let’s get them from this repository: https://mavenanalytics.io/data-playground
For simplicity, a very small subset of the Space Missions dataset will be taken. But don’t hesitate to substitute your own things here.
| Region | Year | Price | Result |
|---|---|---|---|
| Asia | 2020 | 64.68 | Success |
| Europe | 2020 | 200 | Success |
| America | 2020 | 115 | Success |
| Asia | 2021 | 100 | Failure |
| Europe | 2021 | 200 | Success |
| America | 2021 | 109 | Success |
| Asia | 2022 | 64.68 | Success |
| Europe | 2022 | 200 | Success |
| America | 2022 | 145 | Success |
Let’s build a 3D column chart out of that, with region on the X-axis, price on the Y-axis, and year on the Z-axis, while pile colour will indicate the mission status: blue for success and red for failure.
Preparing the Xcode project
Create a new visionOS project in Xcode, choosing the following essential settings:
- Initial Scene: Volume
- Immersive Space Renderer: RealityKit
- Immersive Space: Mixed
Several things will be generated automatically, which we are going to discard to keep our tutorial simple.
First, remove the ContentView, ToggleImmersiveSpaceButton, and AppModel file from the project.
Second, in the <projectName>App file, change its pre-generated content by
import SwiftUI

@main
struct ImmersiveChartApp: App {
    var body: some Scene {
        ImmersiveSpace(id: "<projectName>") {
            ImmersiveView()
        }
    }
}
This will start up XR straight away on startup.
Third, in the ImmersiveView file, change its pre-generated content by
import SwiftUI
import RealityKit

struct ImmersiveView: View {
    var body: some View {
        RealityView { content in
        }
    }
}

#Preview(immersionStyle: .mixed) {
    ImmersiveView()
}
Fourth, in Info plist, change the value of Preferred Default Scene Session Role setting to Immersive Space Application Session Role.
At this point, your project should build and run, showing absolutely no content.
Connecting the NChart3D framework
Before connecting NChart3D, you have to connect its dependencies. It requires Metal.framework, MetalKit.framework, ImageIO.framework, and libc++.tbd library.
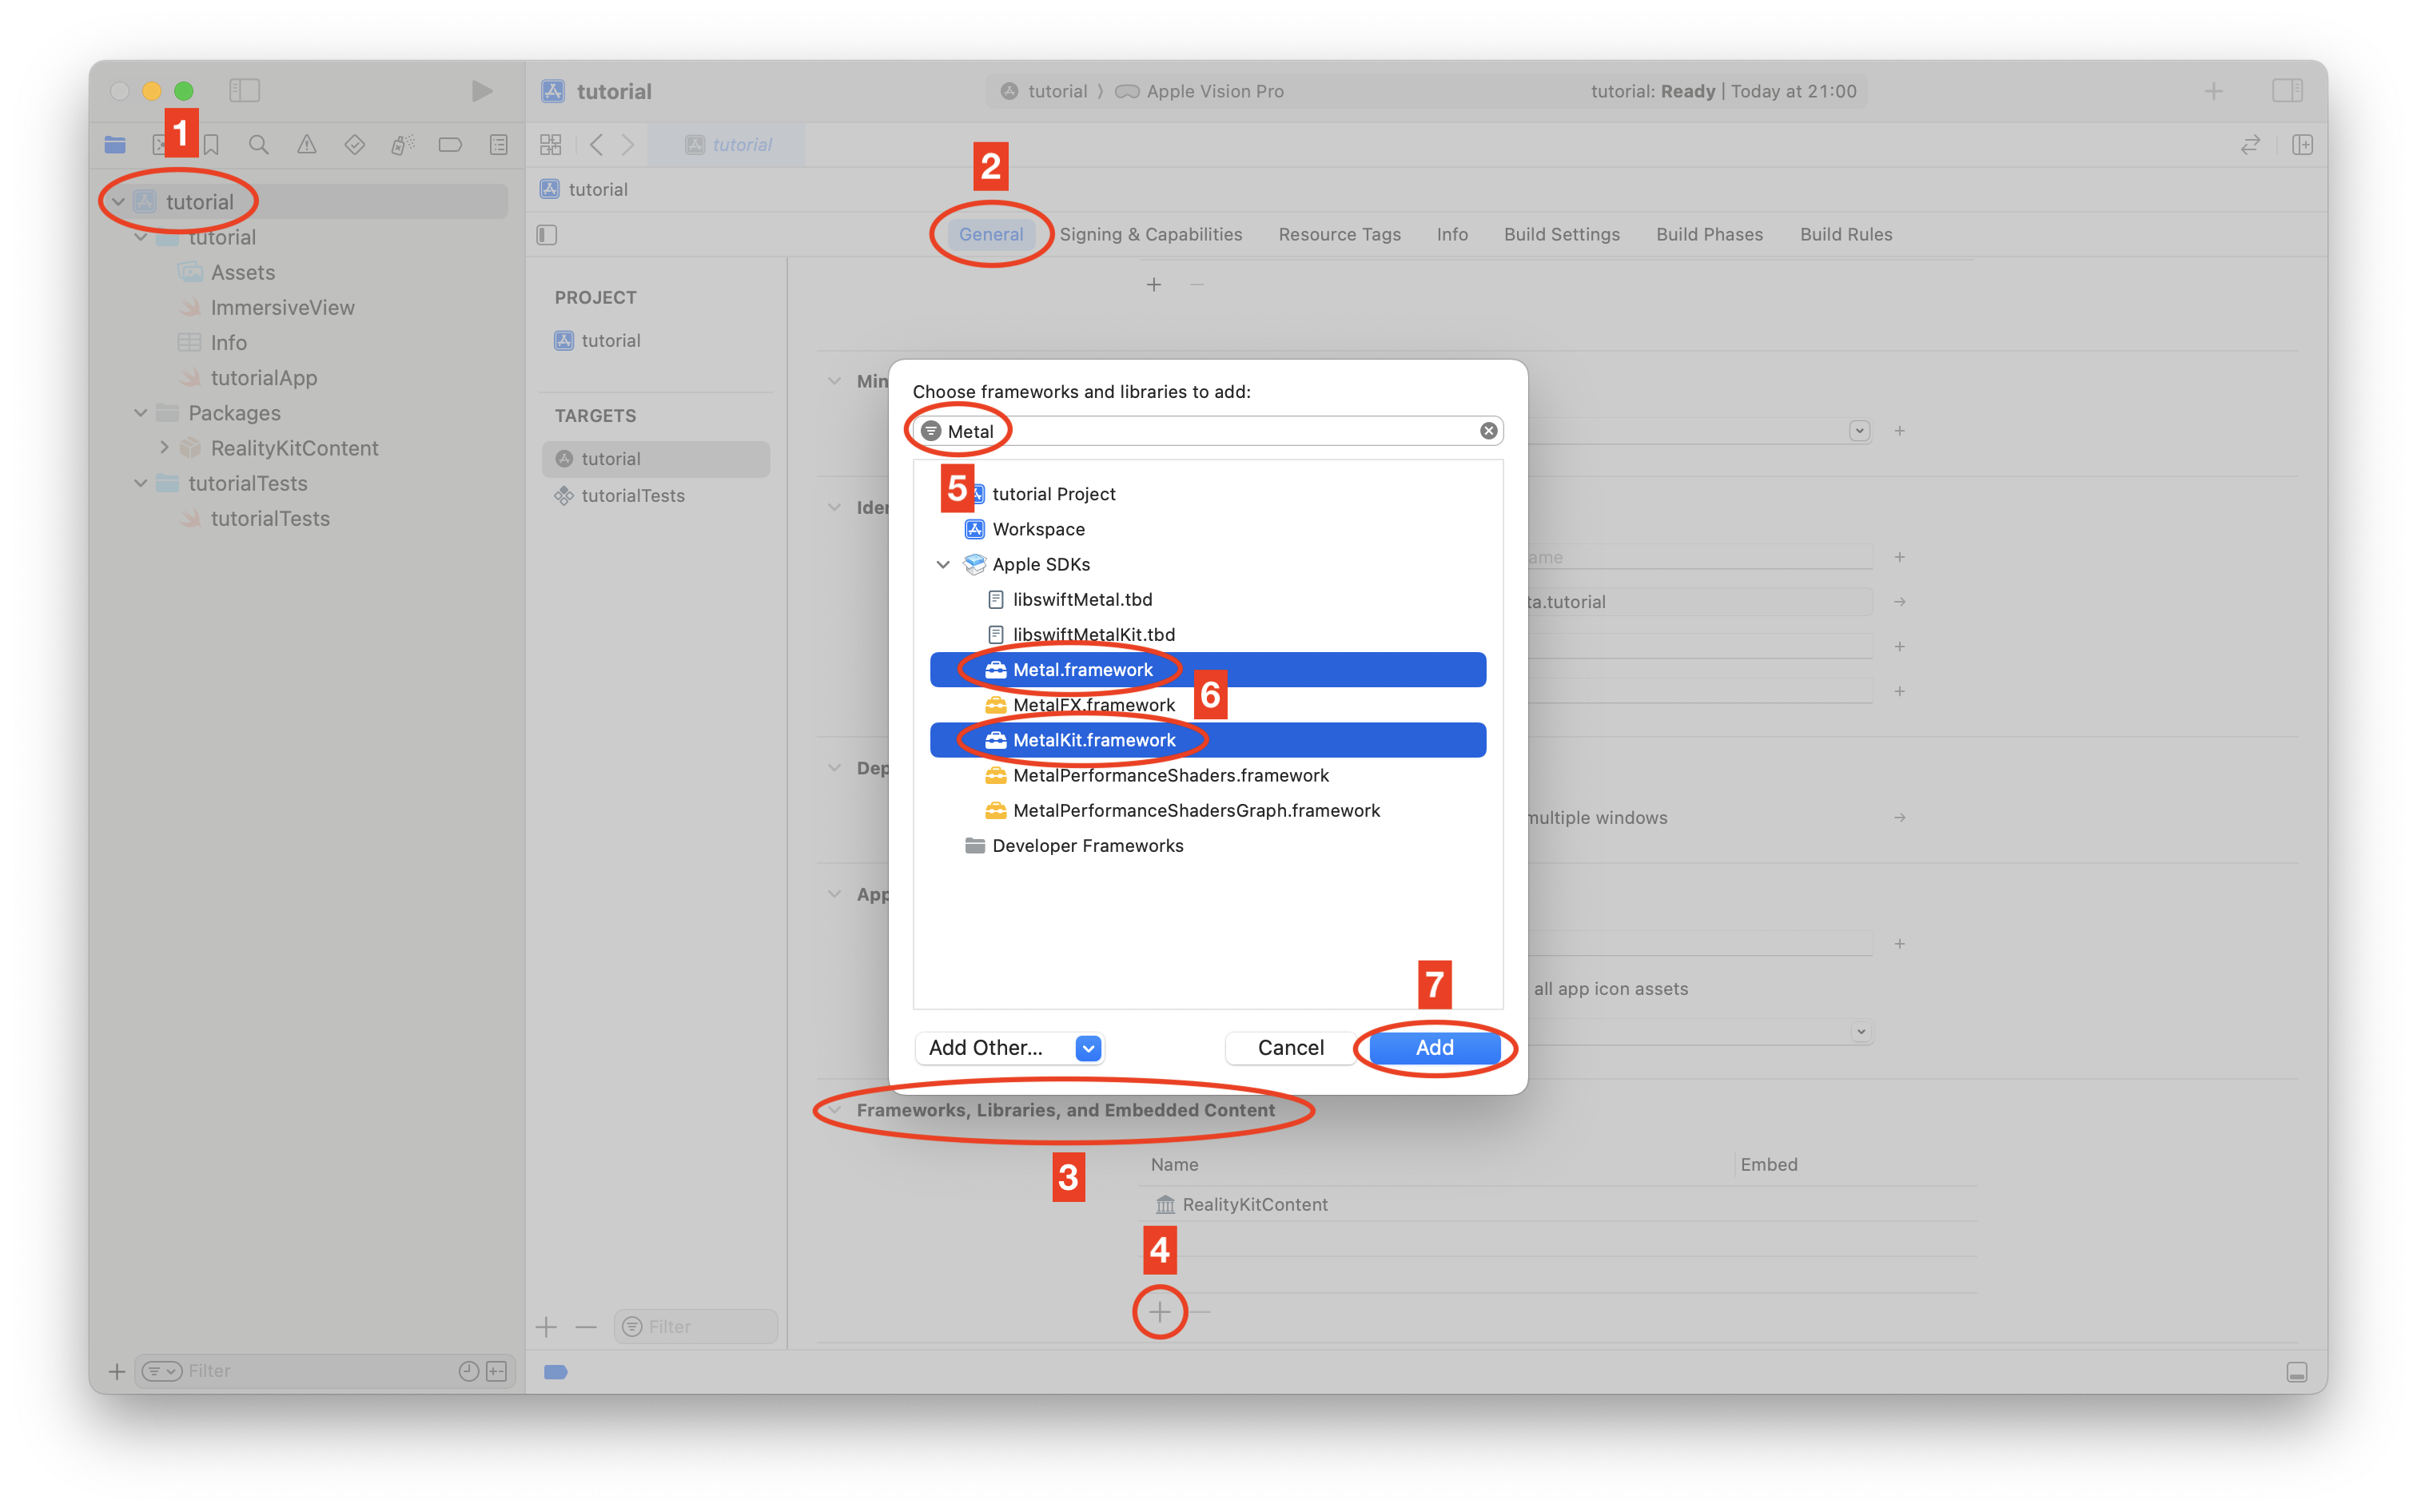
Click on the root of your projects, then in the General tab, scroll to Frameworks, Libraries, and Embedded Content. Hit the Plus button at the end of the section, and in the appeared window, type Metal. From the filtered list of frameworks, select both Metal.framework and MetalKit.framework, and then click Add.
Then, hit Plus again, type ImageIO, then select and add ImageIO.framework. Then, hit Plus once again, type libc++, then select and add libc++.tbd library. Make sure libc++.tbd appears both in the Frameworks folder of your project and in the list of Frameworks, Libraries, and Embedded Content. If it does not, add it again.
Now you can connect NChart3D itself. Drag NChart3D.xcframework from the NChart3D for visionOS DMG to the Frameworks folder and click Finish in the framework appending window that appears when you drag. Generally, the default settings listed in this window should be OK, so you don’t need to alter them.
The project should build without errors at this point.
Creating the chart bridge
To place a 3D chart in your scene, you need a bridge that will create a chart and export it as a RealityKit-compatible 3D object.
Right-click on the folder with the source files of your project and choose New Empty File. Call the file ChartBridge (or anything else you like). In fact, this will be the main file in your project.
First, import the frameworks:
import SwiftUI
import RealityKit
import Foundation
import NChart3D
Then create a class conforming to the 3 mandatory protocols:
class ChartBridge: NSObject, NChartSeriesDataSource, NChartRealityKitModelDelegate {
}
This class will create the chart, provide the data for it (that’s the duty of the NChartSeriesDataSource protocol), and act as a converter from NChart3D to RealityKit (this is what the NChartRealityKitModelDelegate protocol specifies).
In this class, create three variables you will need:
var chartRK = NChartRealityKit()
var chartRoot: Entity?
var modelID = 0
chartRK is the actual entry point to the NChart3D framework.
chartRoot will hold the root RealityKit-compatible 3D object of the created chart. In fact, the created chart will be a set of hierarchical 3D objects, but normally, you don’t need to manipulate individual ones. Instead, you will have chartRoot at hand and do all the manipulations on it, while the rest of the hierarchy will follow the root automatically.
modelID is just an internal variable which will be needed in the chart conversion process.
Define a function
func createChart(root: Entity) {
    chartRoot = root
}
It will be used to create the chart, and we’ll populate it later.
To conform to the NChartSeriesDataSource protocol, define functions
func seriesDataSourcePoints(for series: NChartSeries!) -> [Any]! {
    var result: [NChartPoint] = []
    return result
}

func seriesDataSourceName(for series: NChartSeries!) -> String! {
    return nil
}
Later, it will provide the data to the chart.
To conform to the NChartRealityKitModelDelegate protocol, define a function
func modelReady(withPositions positions: UnsafePointer!,
    normals: UnsafePointer!,
    texCoords: UnsafePointer!,
    primitives: UnsafePointer!,
    vertexCount: Int32,
    indexCount: Int32,
    texture: CGImage!,
    color: UIColor!,
    shading: Bool) {

    // This method is called for every single 3D object created by NChart3D.
    // Based on the data supplied, the RealityKit 3D model should be created and appended to the RealityKit view content.

    // Create the RealityKit model descriptor for the current model.
    let modelName = String(format: "chartModel-%d", modelID)
    var rtMdlDtr = MeshDescriptor(name: modelName)
    modelID += 1

    // Populate the model descriptor.
    if (positions != nil) {
        rtMdlDtr.positions = MeshBuffers.Positions(UnsafeBufferPointer(start: positions, count: Int(vertexCount)))
    }
    if (normals != nil) {
        rtMdlDtr.normals = MeshBuffers.Normals(UnsafeBufferPointer(start: normals, count: Int(vertexCount)))
    }
    if (texCoords != nil) {
        rtMdlDtr.textureCoordinates = MeshBuffers.TextureCoordinates(UnsafeBufferPointer(start: texCoords, count: Int(vertexCount)))
    }
    if (primitives != nil) {
        rtMdlDtr.primitives = .triangles([UInt32](UnsafeBufferPointer(start: primitives, count: Int(indexCount))))
    }

    // Create the model material.
    let mat: RealityFoundation.Material
    if (texture != nil) {
        guard let texRes = try?
            TextureResource(image: texture,
                            options: .init(semantic: .color, mipmapsMode: .none))
        else {
            return
        }
        let clr = PhysicallyBasedMaterial.BaseColor(texture: .init(texRes))
        if (shading) {
            var smat = SimpleMaterial(color: .white, isMetallic: true)
            smat.color = clr
            smat.roughness = 0.4
            mat = smat
        } else {
            var umat = UnlitMaterial()
            umat.color = clr
            umat.blending = .transparent(opacity: .init(floatLiteral: 0.9999))
            mat = umat
        }
    } else {
        if (shading) {
            mat = SimpleMaterial(color: color, isMetallic: false)
        } else {
            mat = UnlitMaterial(color: color)
        }
    }

    // Generate the RealityKit model from the descriptor and material.
    let model = ModelEntity(
        mesh: try! .generate(from: [rtMdlDtr]),
        materials: [mat]
    )
    // Append the model to the content.
    model.name = modelName
    chartRoot!.addChild(model)
}
This one is large and complicated :) But don’t worry! Normally, you don’t have to modify it unless you want some advanced tricks for the conversion of the 3D objects from NChart3D to RealityKit. In this tutorial, we will not be touching this. Still, if you are keen on experimenting, you can try to modify the materials’ settings, for example, the smat.roughness to see what will happen to the chart.
At this point, the project should build without errors and is ready to create the charts.
Placing the chart in the scene
In the ImmersiveView file, add two variables to the ImmersiveView class:
var chart = ChartBridge()
var chartRoot = Entity()
chart is an instance of our bridge, and chartRoot is the main object we’ll place in the scene.
Then, inside of RealityView, add name and position settings for the chartRoot:
chartRoot.name = "chart"
chartRoot.position = SIMD3(0.0, 0.7, -1.65)
chartRoot.scale = SIMD3(x: 0.4, y: 0.4, z: 0.4)
Then call the bridge to create the chart:
chart.createChart(root: chartRoot)And finally, attach the chart to the scene:
content.add(chartRoot)Displaying the chart
Let’s add the needed settings to the createChart function.
First, assign your license key; otherwise, the watermark will appear:
chartRK.chart.licenseKey = "yourLicenseKey"Then, switch on 3D rendering mode:
chartRK.chart.drawIn3D = trueThen, switch off the legend (in this simple tutorial, we don’t need it):
chartRK.chart.legend.visible = falseThen, create the column series:
let series = NChartColumnSeries()Attach the data source:
series.dataSource = selfAnd add the series to the chart:
chartRK.chart.addSeries(series)Then, ask the chart to create all internal structures:
chartRK.chart.updateData()If you were coding for iOS or macOS, after this call, the chart would already appear on the screen. However, in visionOS, an additional step is required. First, you need to attach the chart binding delegate:
chartRK.delegate = selfAnd then, call a special method which will trigger the chart to create raw objects for RealityKit:
modelID = 0
chartRK.render()
Note that here you initialise the internal modelID variable, which is used to assign unique names for subobjects.
After calling the render() method, NChart3D will call modelReady several times creating the entire set of objects belonging to the chart. modelReady will wrap those objects into RealityKit entities and attach them all to the chartRoot.
But don’t hit the Run button yet, as we still have one important step to take: the data.
To keep things simple, just add the following array to seriesDataSourcePoints:
let data = [
    [ 0, 0, 64.68, "Success" ],
    [ 1, 0, 200.0, "Success" ],
    [ 2, 0, 115.0, "Success" ],
    [ 0, 1, 100.0, "Failure" ],
    [ 1, 1, 200.0, "Success" ],
    [ 2, 1, 109.0, "Success" ],
    [ 0, 2, 64.68, "Success" ],
    [ 1, 2, 200.0, "Success" ],
    [ 2, 2, 145.0, "Success" ]
]
For now, we encode regions as 0 (“Asia”), 1 (“Europa”), and 2 (“America”) in the first column, and years as 0 (2020), 1 (2021), and 2 (2022) in the second column.
Then, add the loop over its elements, creating the chart points:
for entry in data {
    let pointState = NChartPointState(alignedToXZWithX: entry[1] as! Int, y: entry[2] as! Double, z: entry[0] as! Int)
    if entry[3] as! String == "Success" {
        pointState!.brush = NChartSolidColorBrush(color: UIColor(red: 0.38, green: 0.8, blue: 0.91, alpha: 1.0))
    } else {
        pointState!.brush = NChartSolidColorBrush(color: UIColor(red: 0.91, green: 0.2, blue: 0.2, alpha: 1.0))
    }
    result.append(NChartPoint(state: pointState, for: series))
}
Each point is created based on the point state, which in turn has coordinates and a brush. This might look complicated, but in fact, each point might have several states to allow time-based animated transitions. This is, however, outside of the tutorial’s scope.
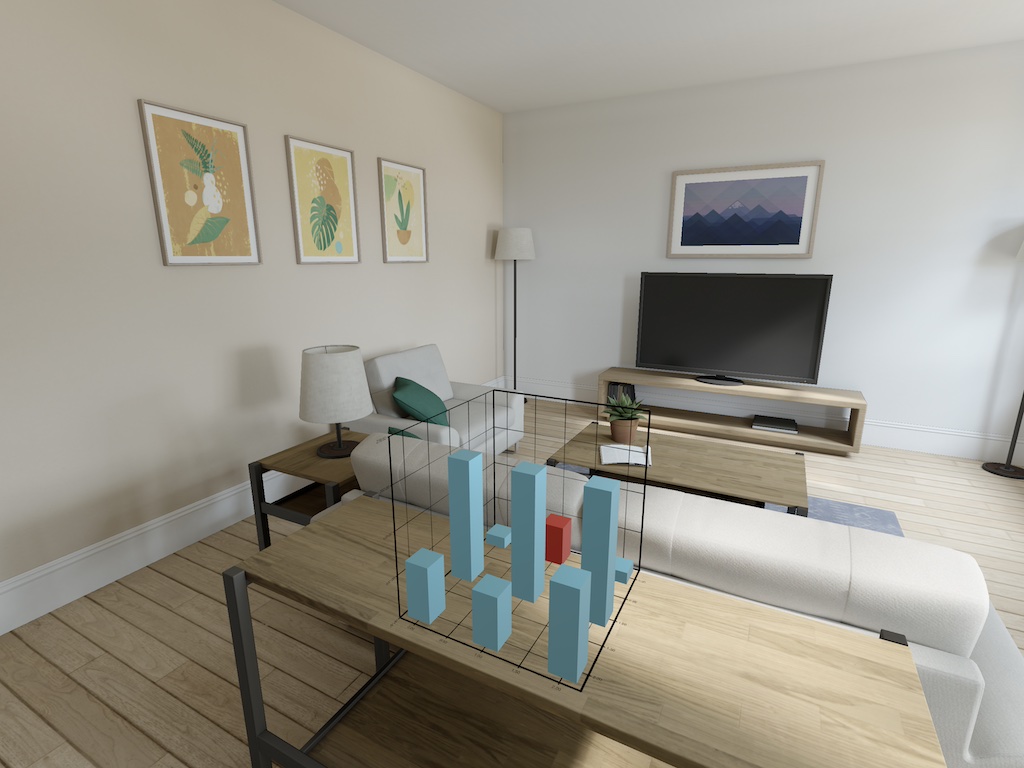
Now, you can run the project, and you should see something like that:
Fine tuning
The axes require some tuning. First of all, let’s make the font bigger. For this, add the following to createChart (before the updateData call):
chartRK.chart.cartesianSystem.xAxis.font = UIFont.systemFont(ofSize: 55)
chartRK.chart.cartesianSystem.yAxis.font = UIFont.systemFont(ofSize: 55)
chartRK.chart.cartesianSystem.zAxis.font = UIFont.systemFont(ofSize: 55)
Also, let’s add proper ticks to the axes. For this, add one more protocol to the ChartBridge class:
class ChartBridge: NSObject, NChartSeriesDataSource, NChartValueAxisDataSource, NChartRealityKitModelDelegate {
After that, attach the data sources to the axes in the createChart function (again, before the updateData call):
chartRK.chart.cartesianSystem.xAxis.dataSource = self
chartRK.chart.cartesianSystem.zAxis.dataSource = self
And implement the function that will provide the ticks:
func valueAxisDataSourceTicks(for axis: NChartValueAxis!) -> [Any]! {
    switch axis.kind {

        case .X:
            return ["2020", "2021", "2022"]

        case .Z:
            return ["Asia", "Europe", "America"]

        default:
            return nil
    }
}
This is what you should see as the result:
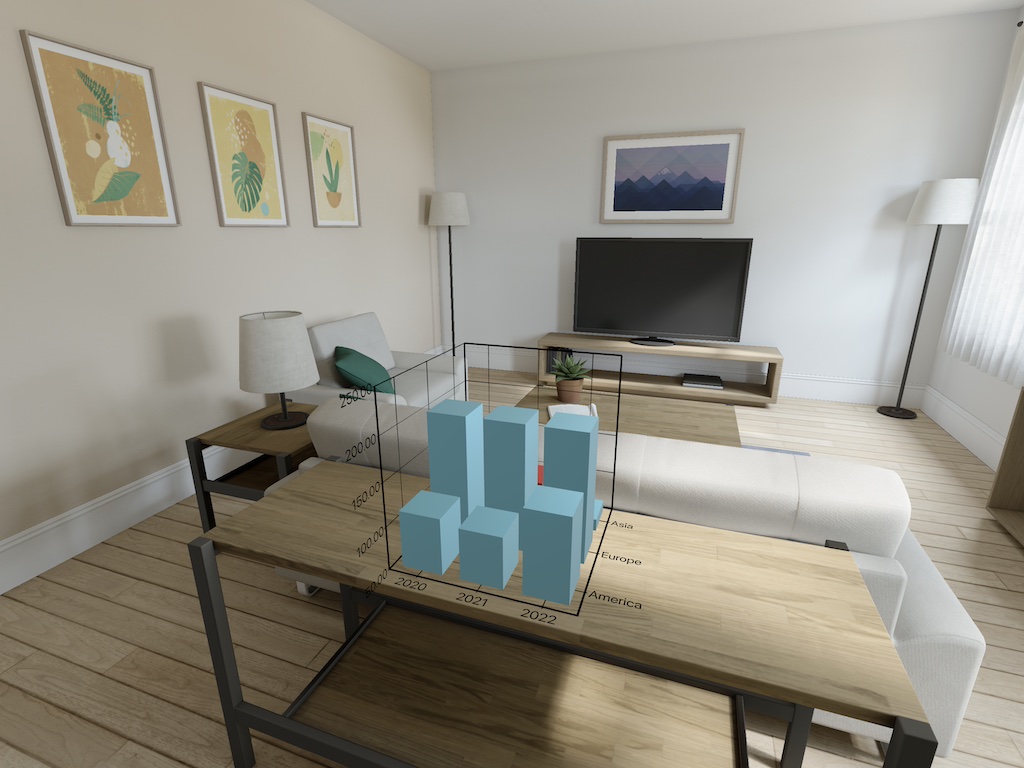
Still not very nice, as the columns are too thick and you cannot see the rear row.
To fix this, add the following after the code creating the column series:
let settings = NChartColumnSeriesSettings()
settings.fillRatio = 0.4
chartRK.chart.add(settings)
This will give you the final result as shown at the beginning of this tutorial.
Conclusion
That’s it for the basic tutorial. Now feel free to experiment by yourself, checking out the set of samples available in the DMG and the documentation available online. And if you have any questions, you can always reach the NChart3D support.