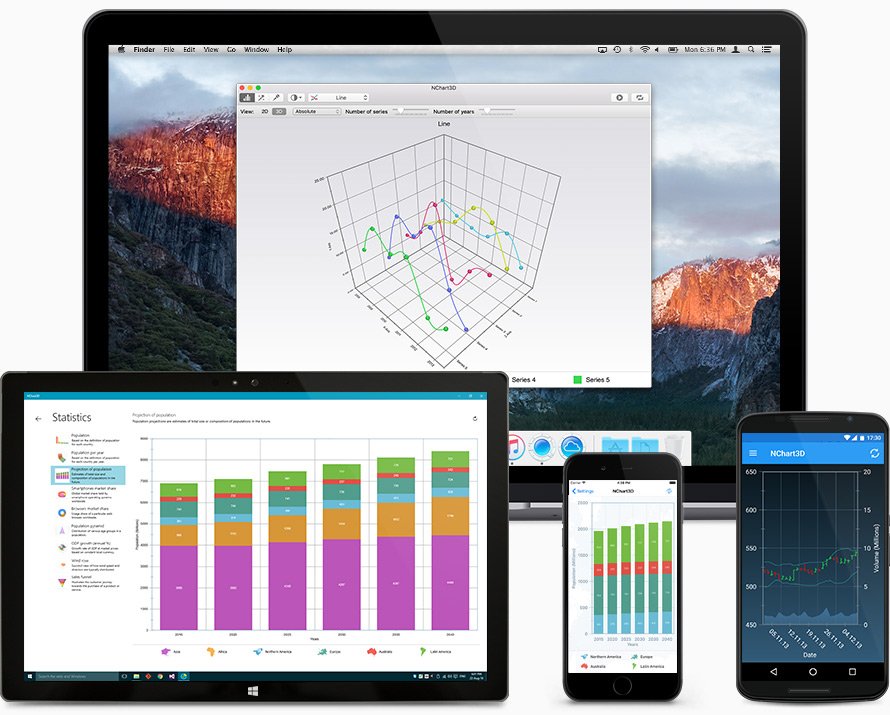
Awesome charts for your next app!
Native charting framework for data visualization. Multiple chart types, 2D & 3D, lighting effects and animations make your data look gorgeous.
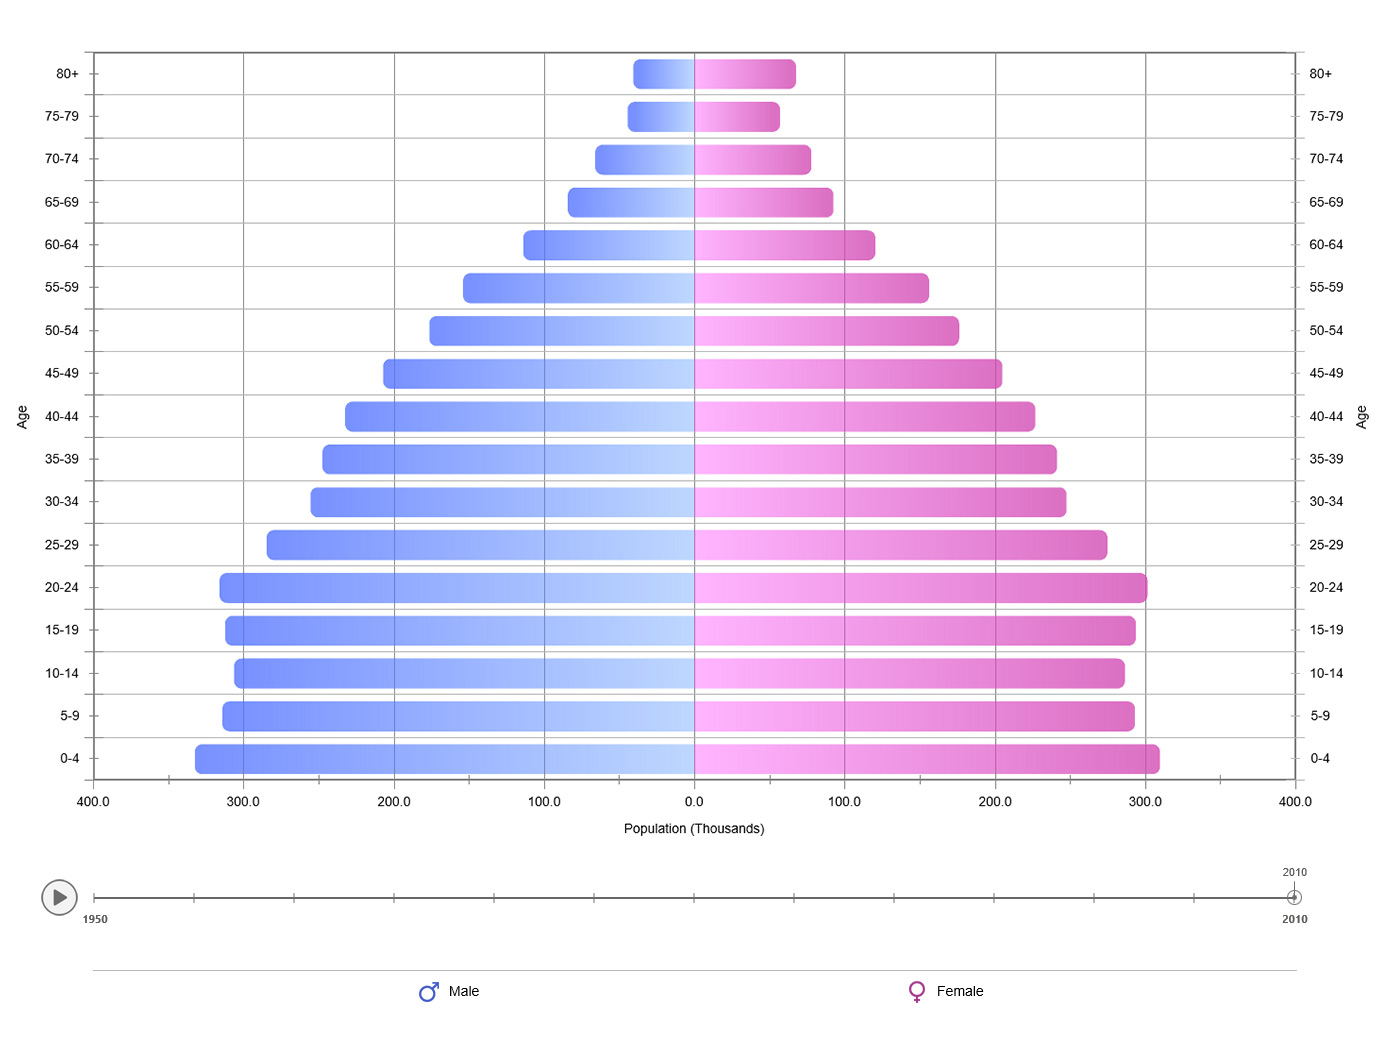
2D, 3D and Animations
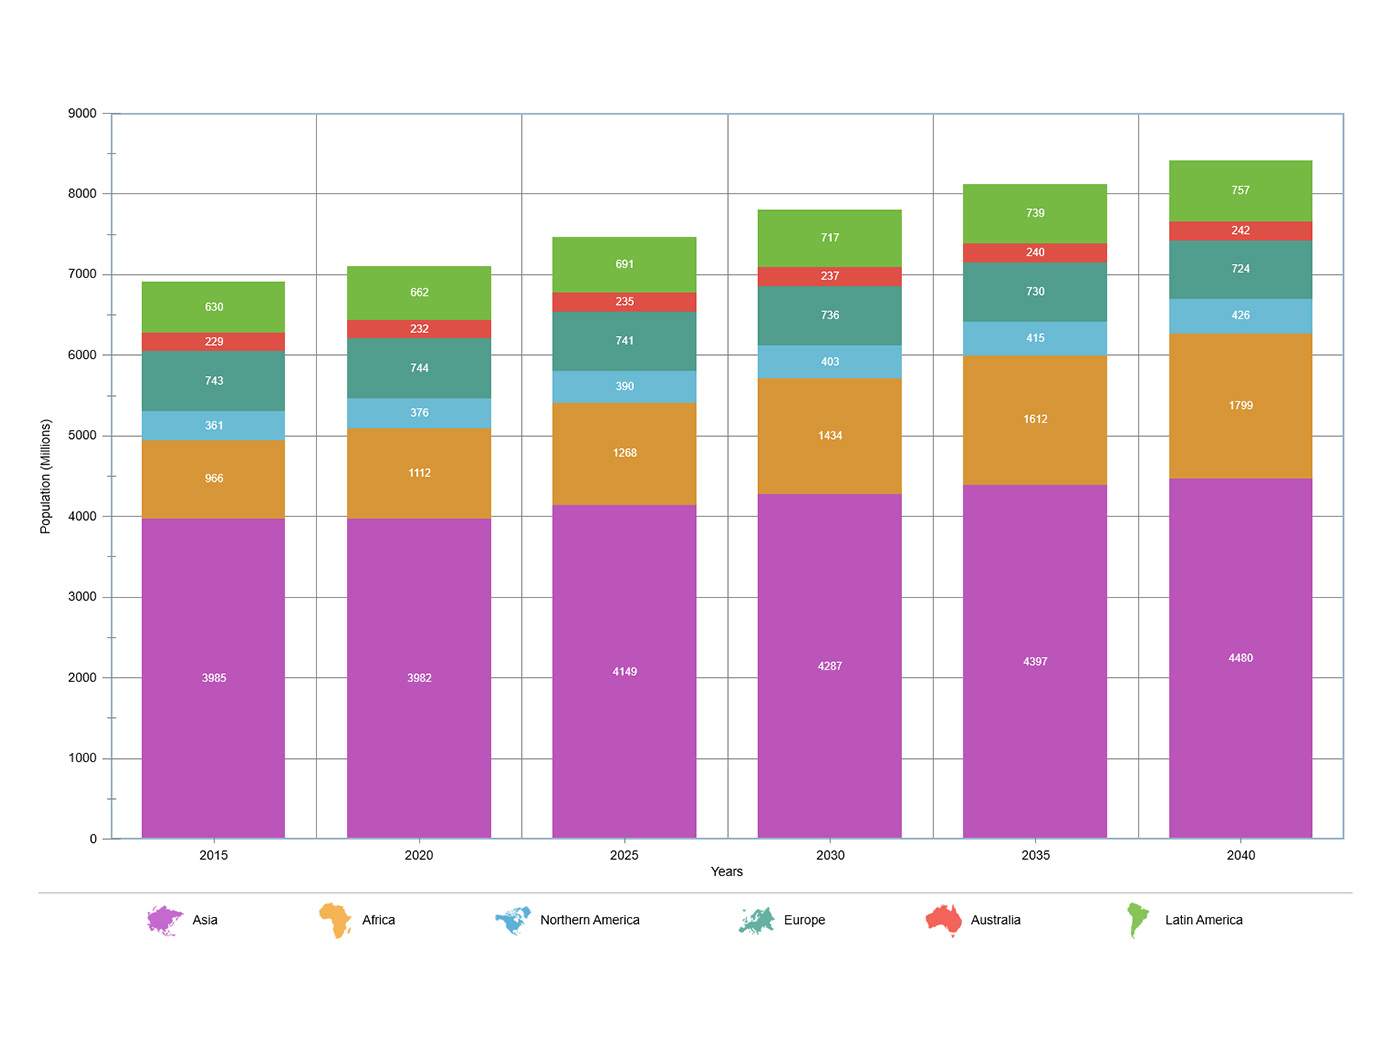
Plain charts are easy-to-read and informative. There is a variety of chart types (such
as
column, pie, bar, line, etc) whatever suits your specific dataset or particular needs.
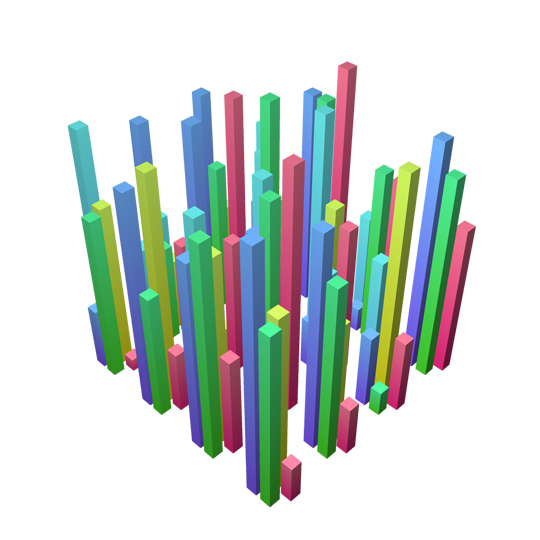
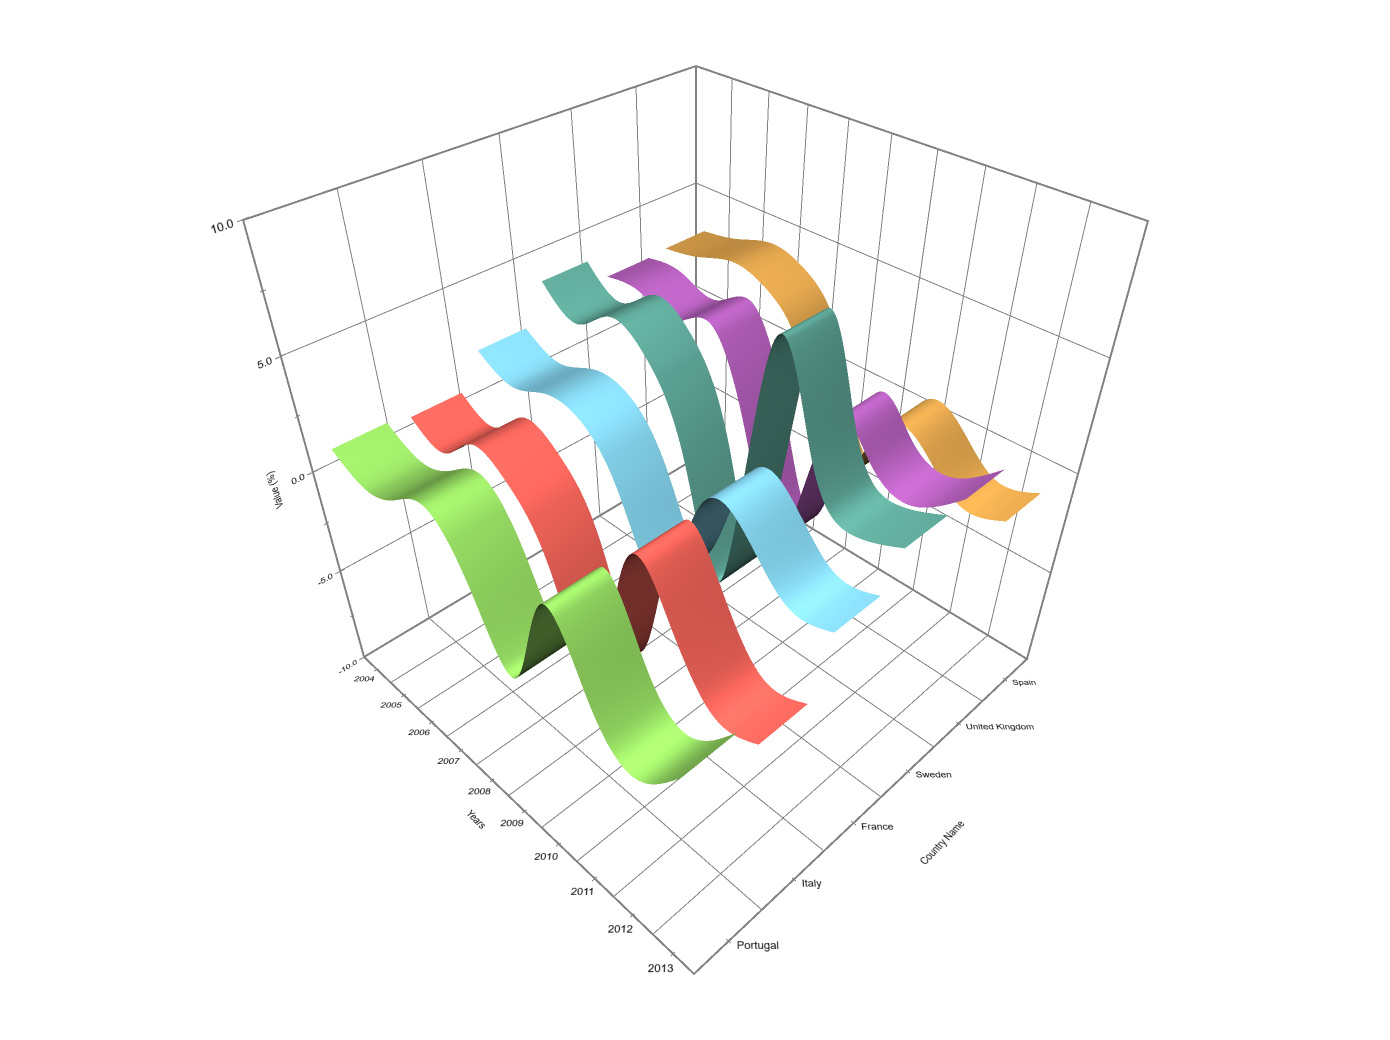
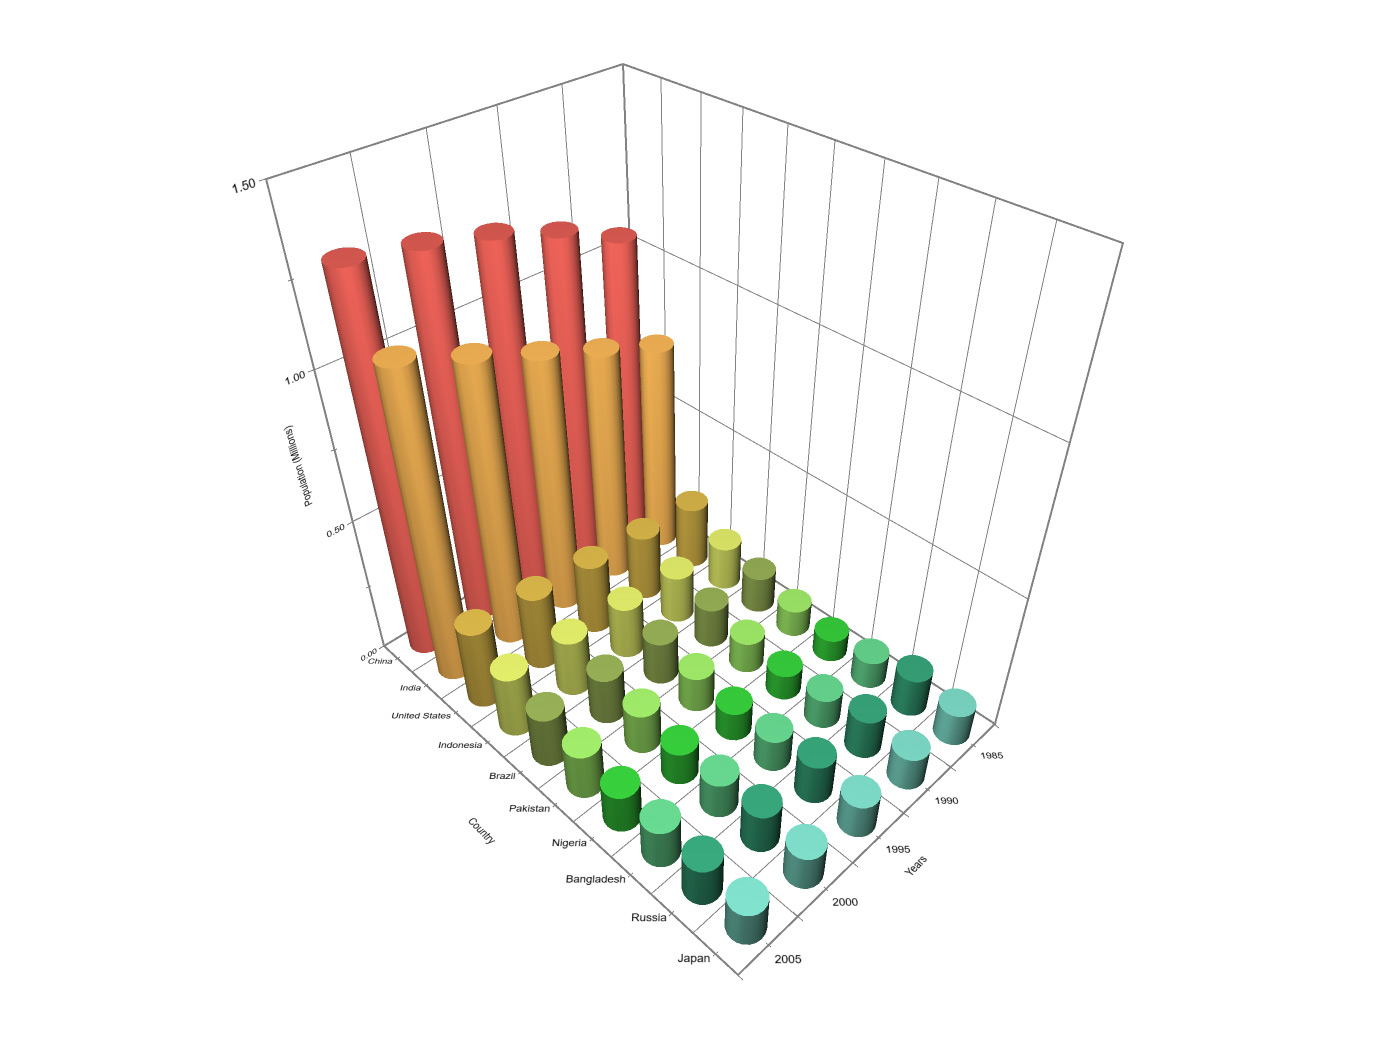
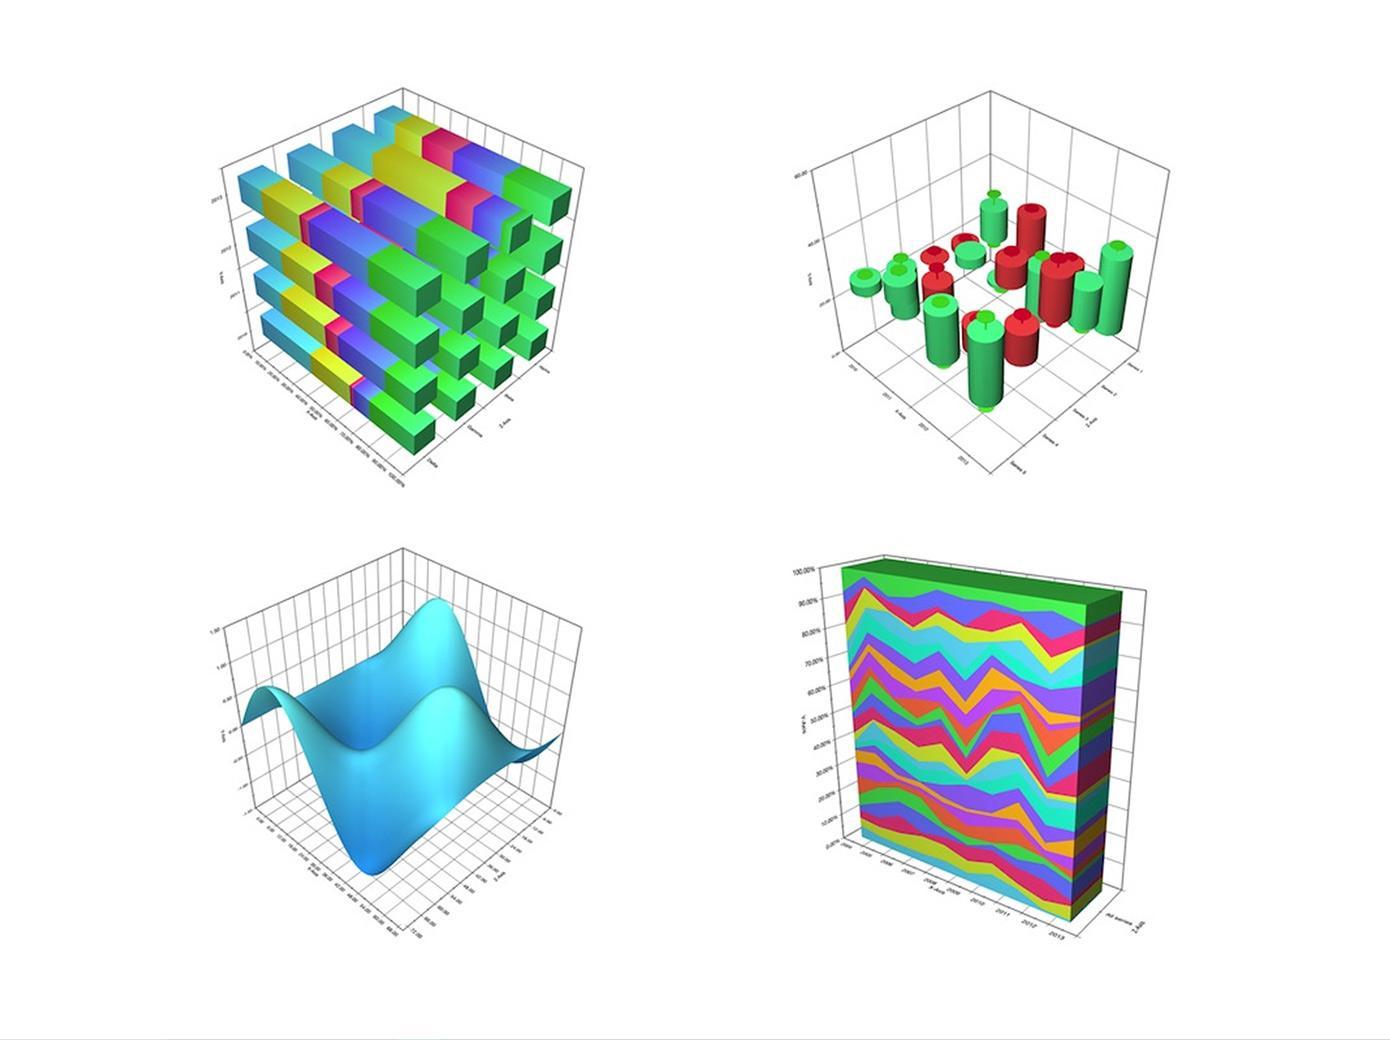
With our powerful set of 3D charts you can visualize multidimensional data or just add
a 3D
effect to your plain charts. For example, spice up a graph with shading.
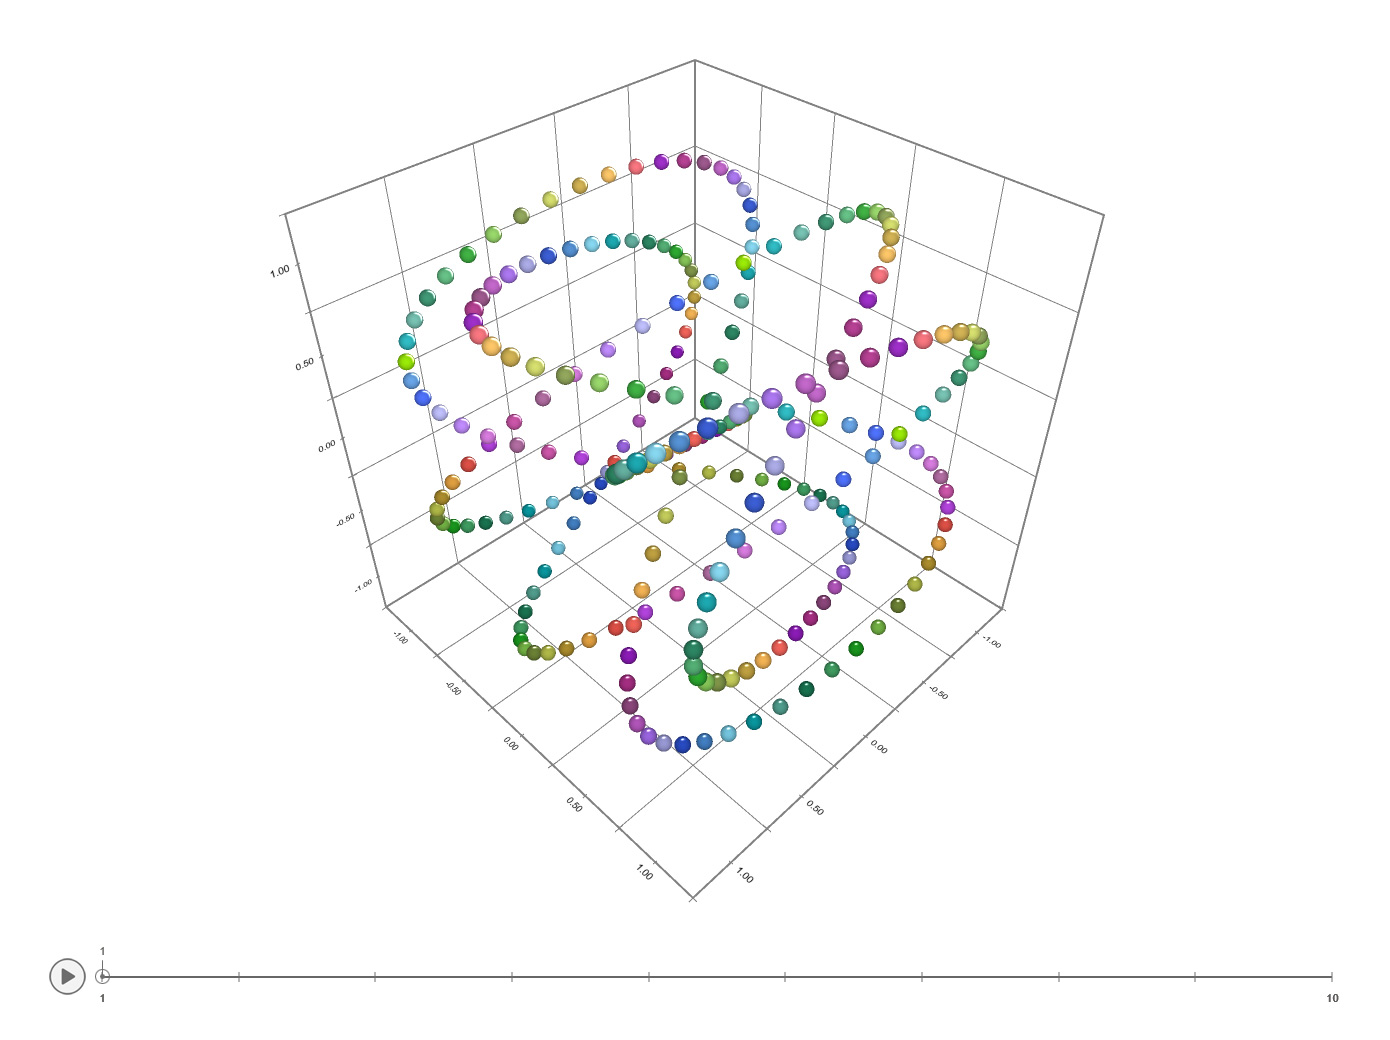
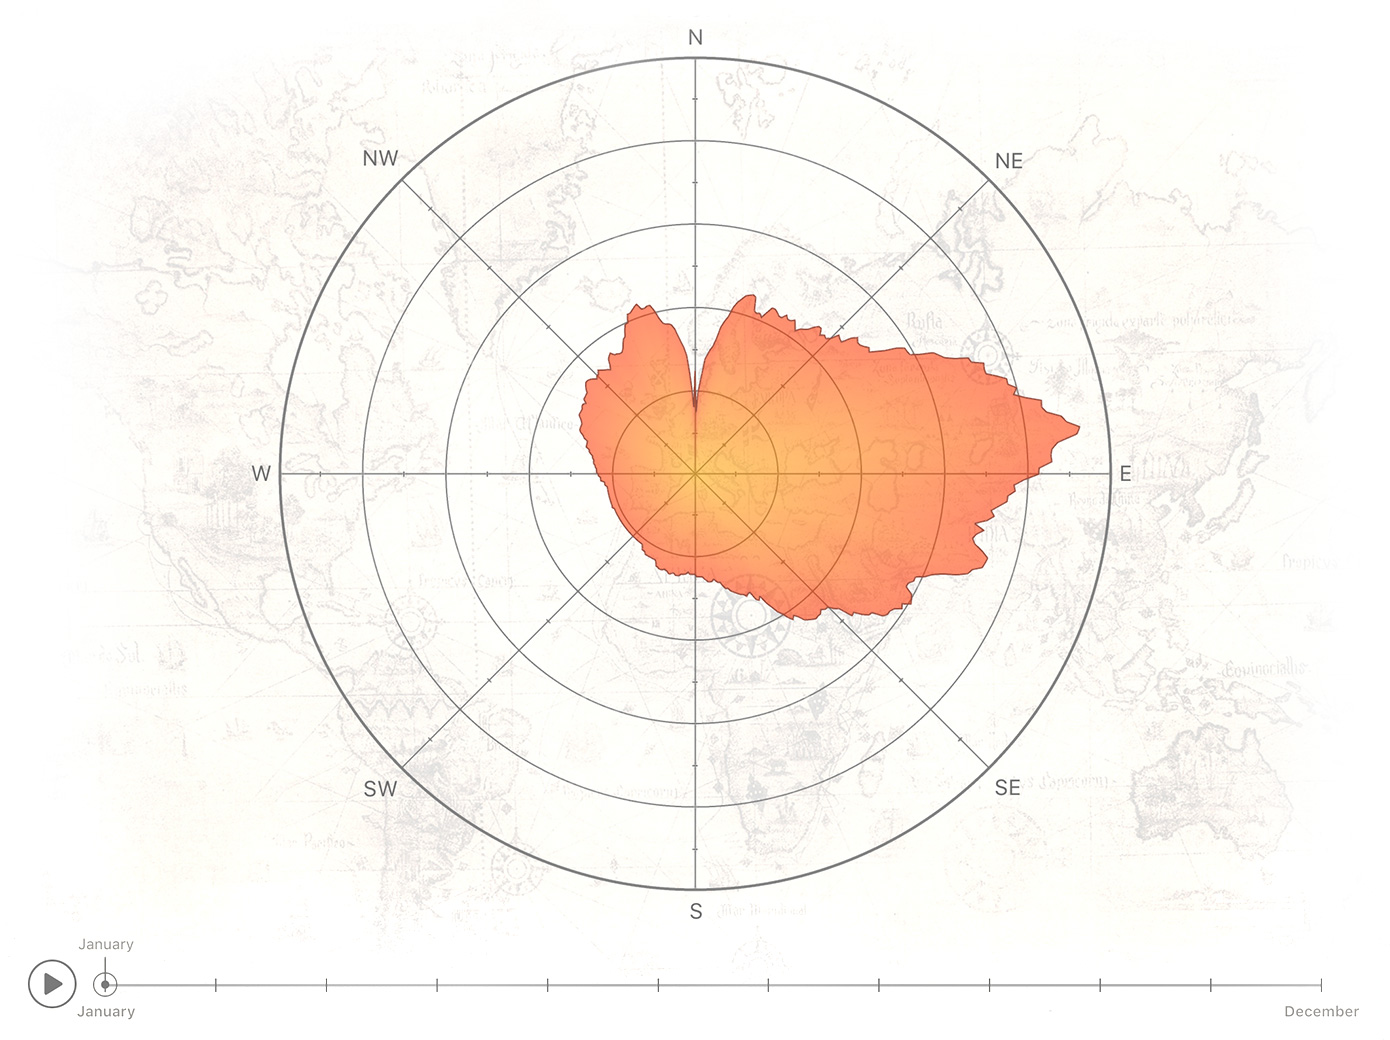
If input data or its representation has changed, the chart will be animated,
transforming
the former image into the latter. The animation can be repeated as many times as you
want.
perfect for analytics
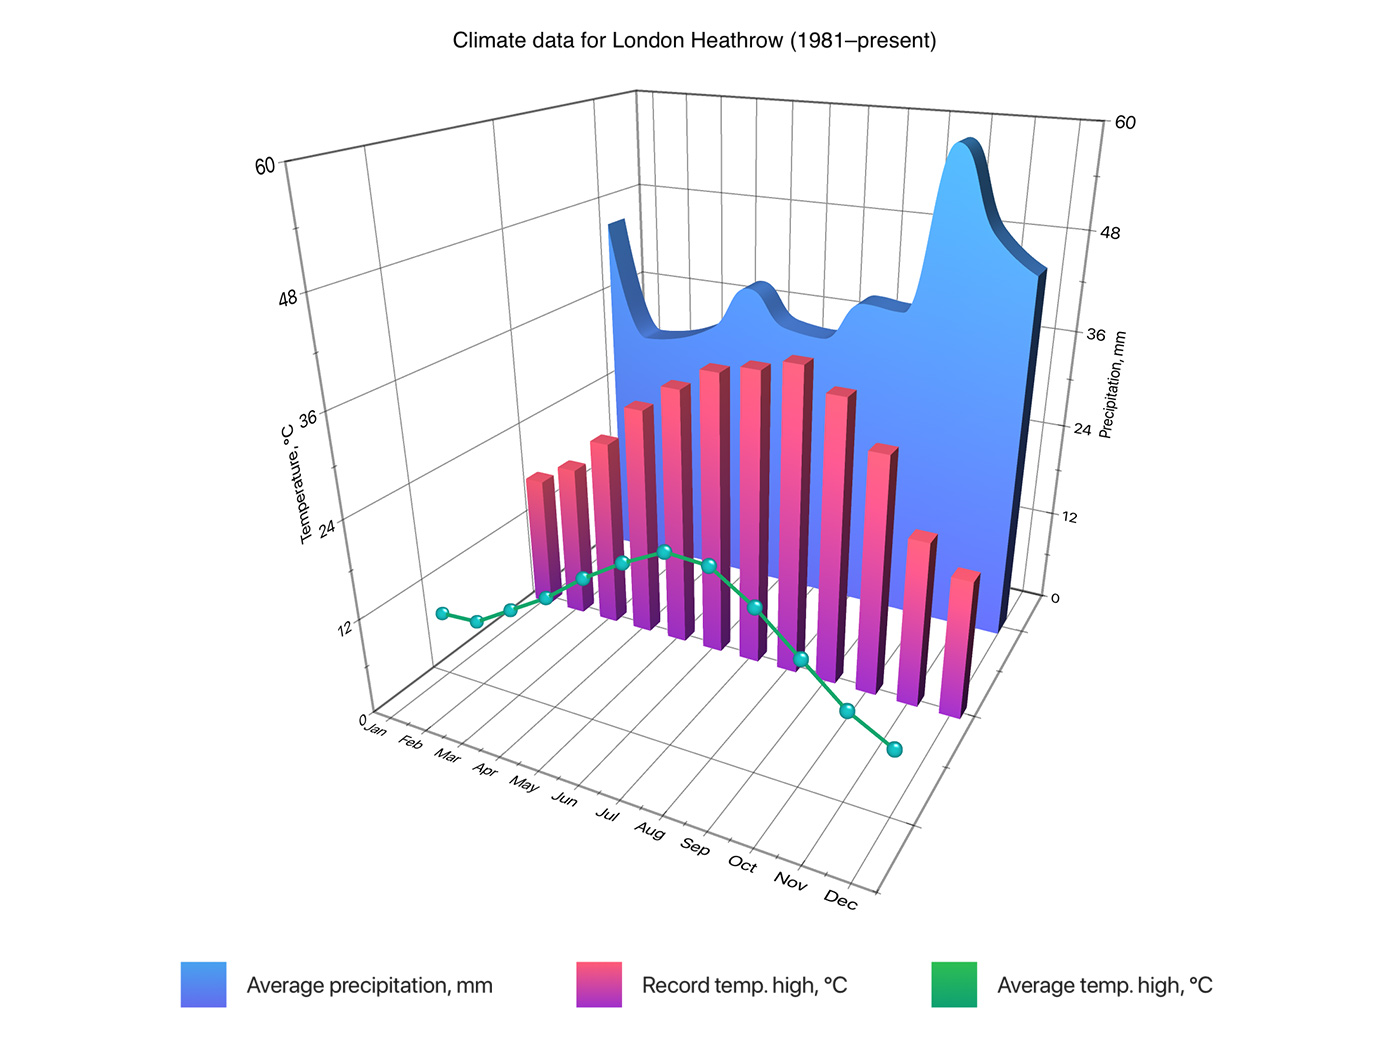
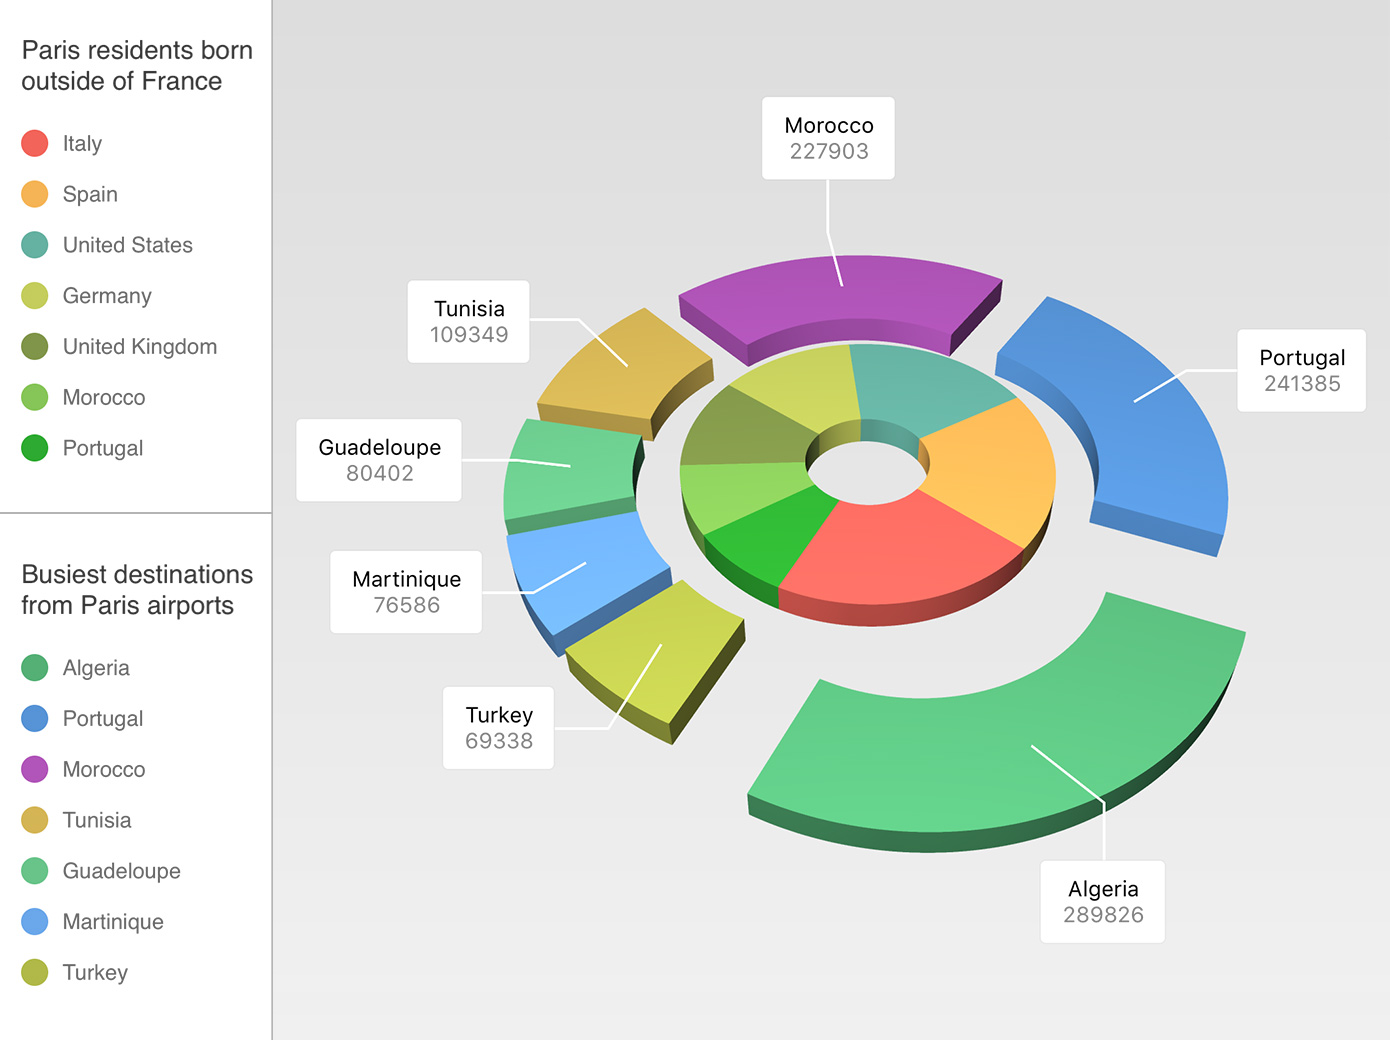
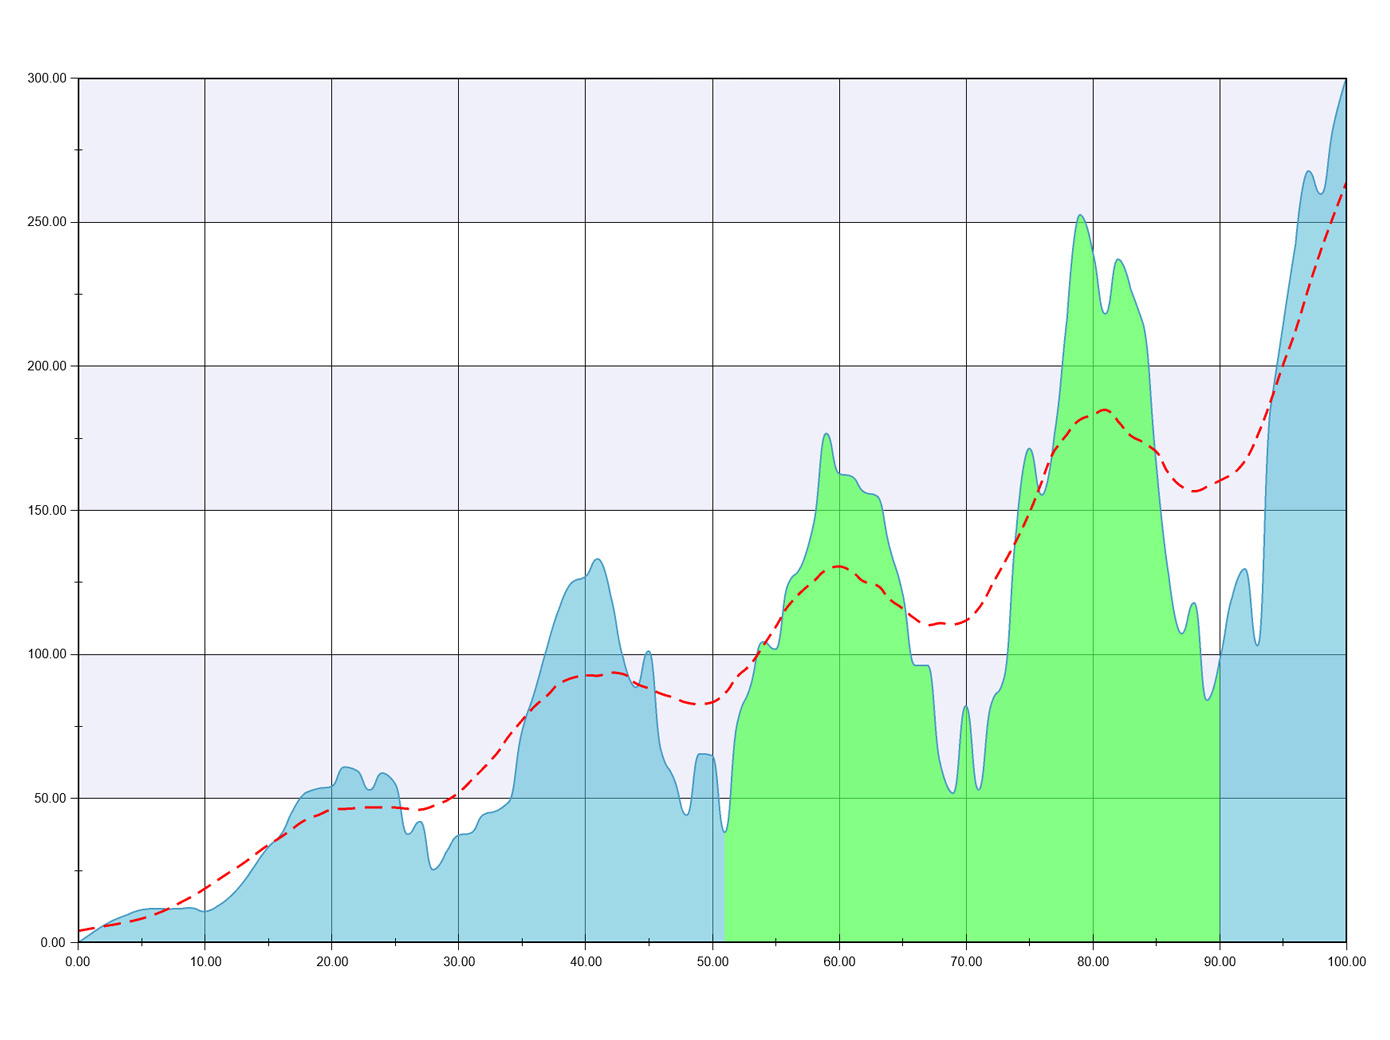
There is a variety of choices to display decision-relevant information. Сombine different chart types to display different sets of data at once.
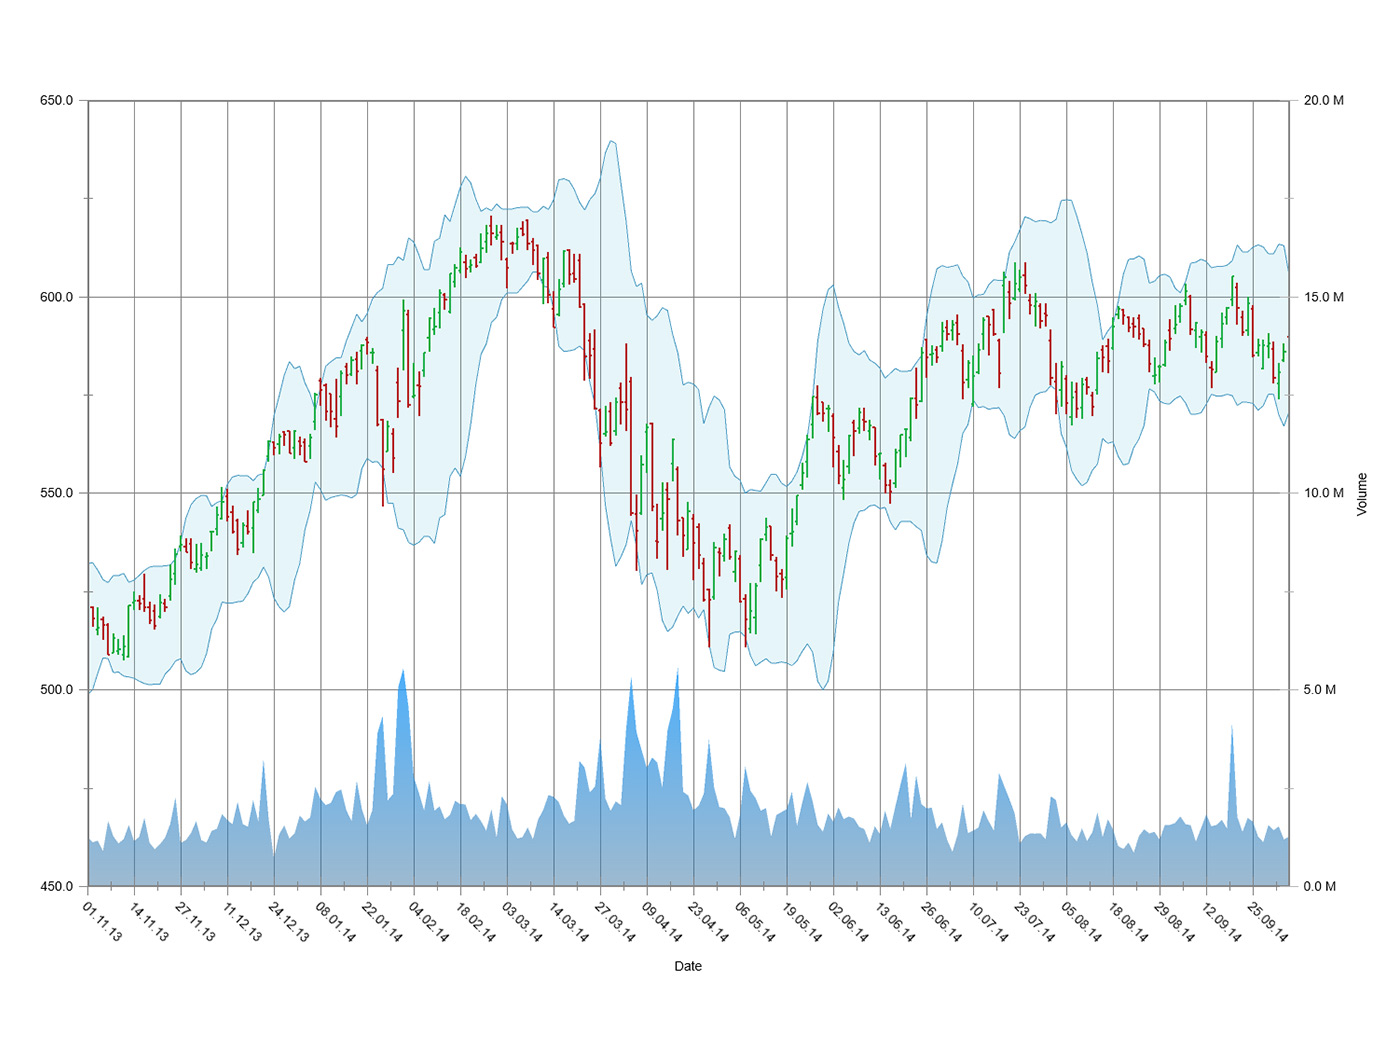
perfect for business
Want to display financial or stock data? The candlestick chart describes price movements over time.
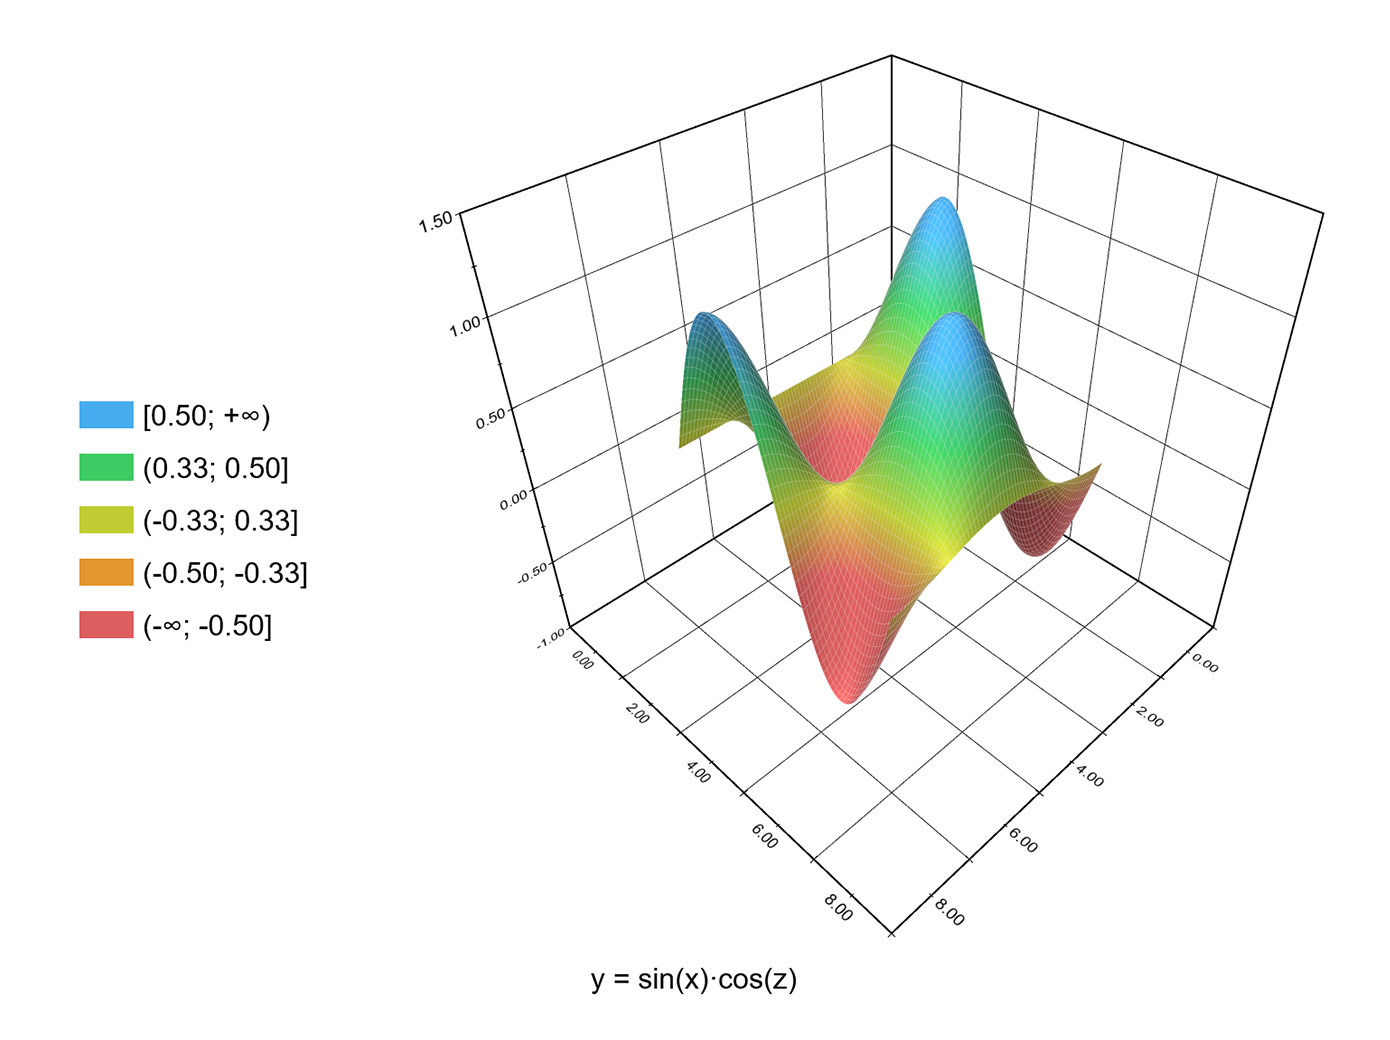
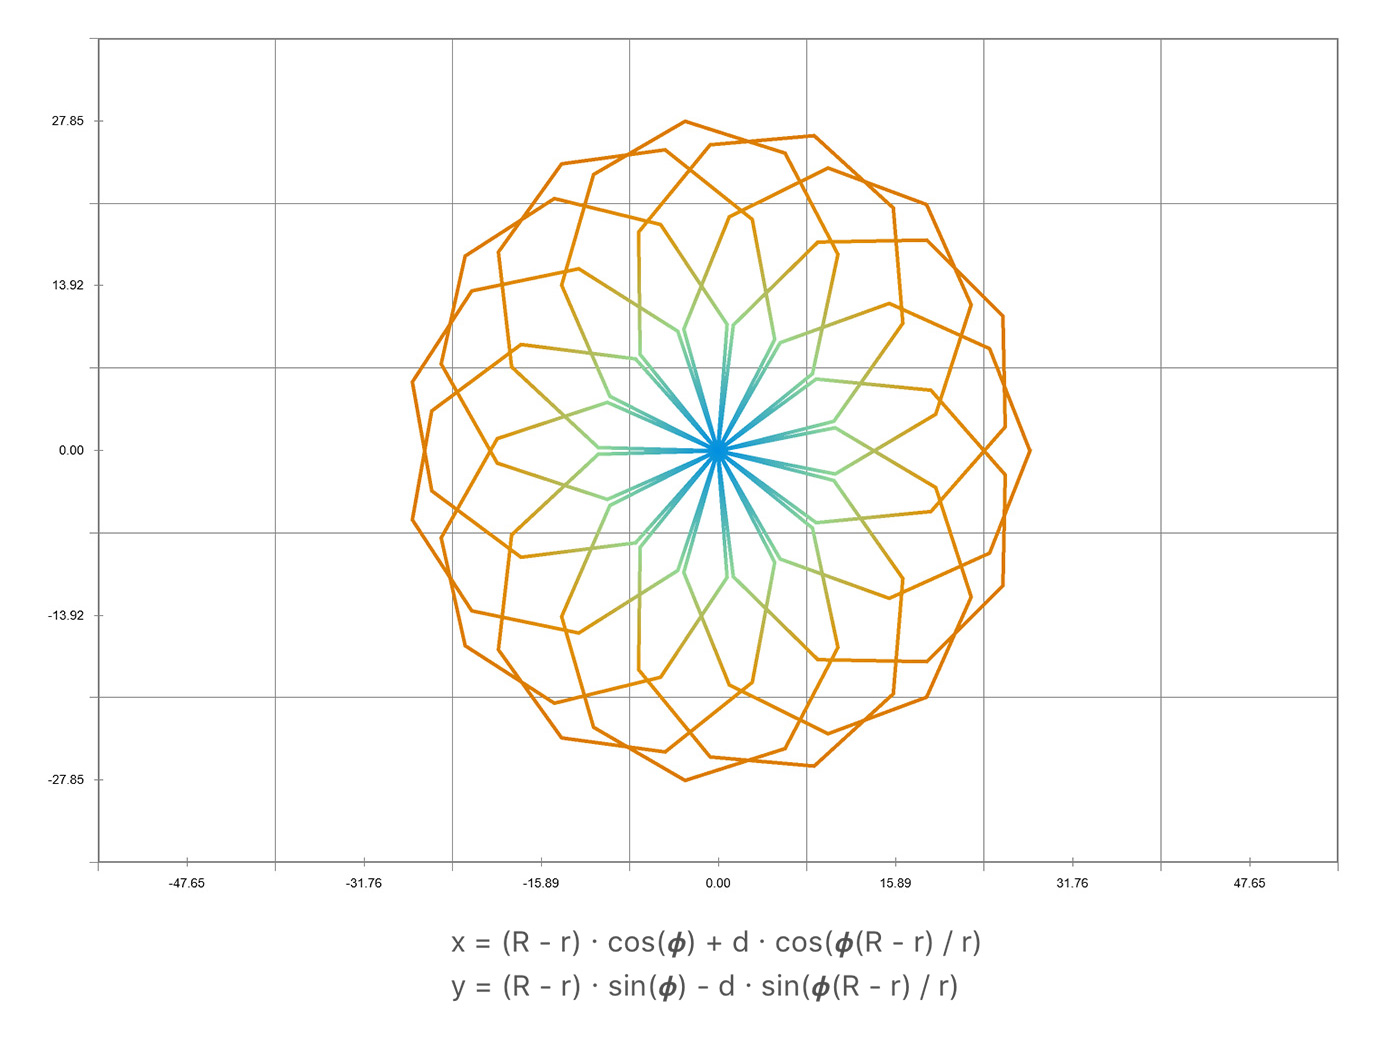
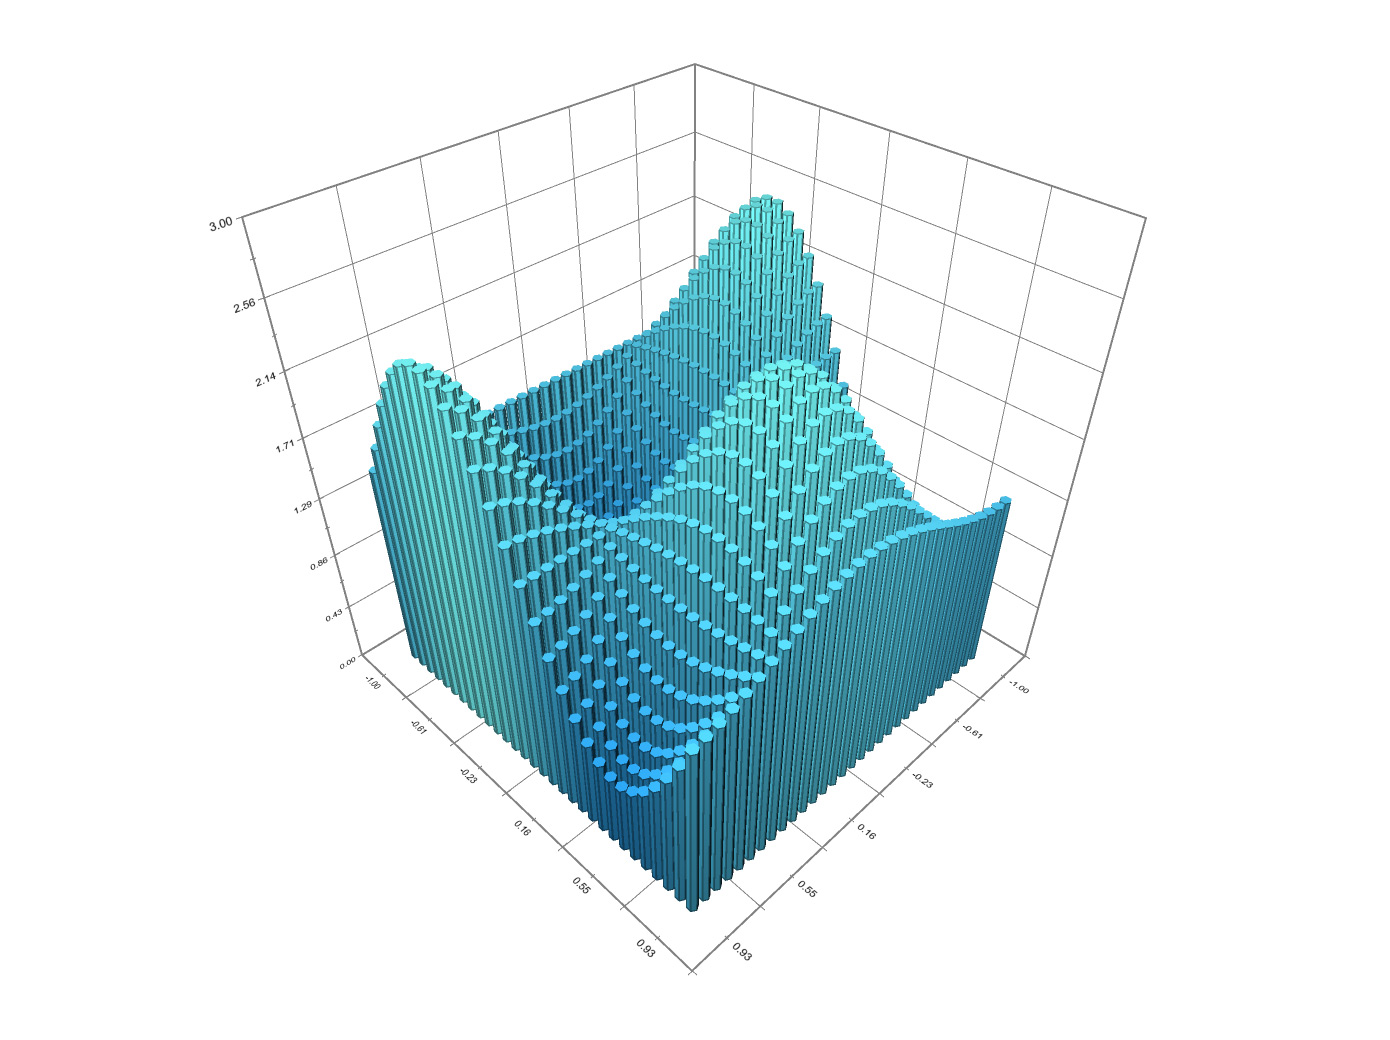
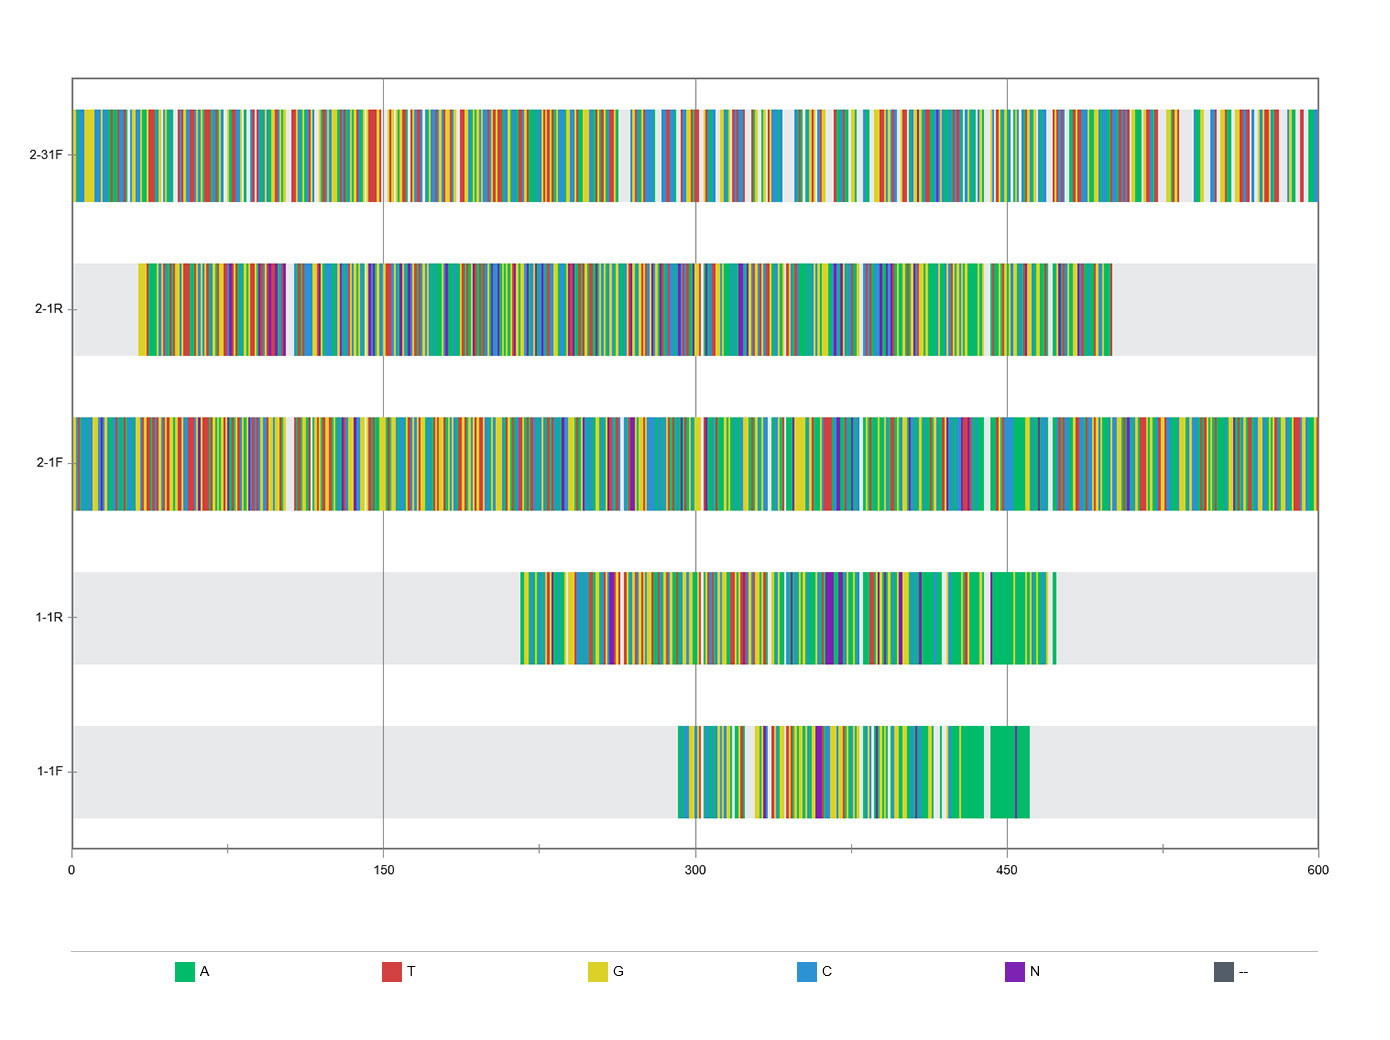
perfect for science
For education or science applications, NChart3D provides plotting graphs and surfaces.
universal charting framework
The main element of NChart3D is the standard view subclass, so it is possible to place
it anywhere in the view hierarchy of your applications.
Supply the chart points and select the chart types – the rest is done automatically.
Excellent data visualization is only a couple of code lines away!
2D & 3D interactive charts, automatic animations and perfect visual effects are
supported
to bring beauty and dynamics to your applications.
Look and Feel
We spent a lot of time adding amazing lighting effects with shaders to make the 3D
diagrams
look clear and vivid.
The object borders are perfectly smooth, while the performance is still beyond
comparison
thanks to adaptive anti-aliasing algorithm.
Use external 3D models from .3DS and .PLY files to decorate your chart with custom objects.
What is an mobile app without a set of intuitively usable gestures such as zoom, pan
and 3D
rotation? These are out of the box features.
Individual points on a chart are selected with a simple tap. The selecting event can be
passed to the parent application, so you can process it yourself.
Thanks to the hardware graphics acceleration used in NChart3D the charts remain
interactive
even for huge datasets.
Building blocks
The visual appearance of the chart elements is fully customizable. You can use solid
colors, gradients and even textures (for 3D models). Each element like caption, legend,
tooltip, etc. of chart is customizable. You can alter colors, borders and visibility of
elements.
Each value axis can be duplicated to display additional information. You can choose
which
series is drawn by a particular value axis.
There is no limit to the number of chart views on the screen. Each of them can be
customized individually and display its own data.
The layout of elements is automatically adjusted to the frame the chart will be
displayed
in. The values on the axis are automatically calculated to look attractive.