• Home
  • Nchart3D
  • NGrid
  • Customers
  • Live demo
  • Download
  • Purchase
  • Blog
  • Support
  • Login
Contact us Terms of service Privacy policy ©   Anjuta Software
NGRID
NGridNGrid

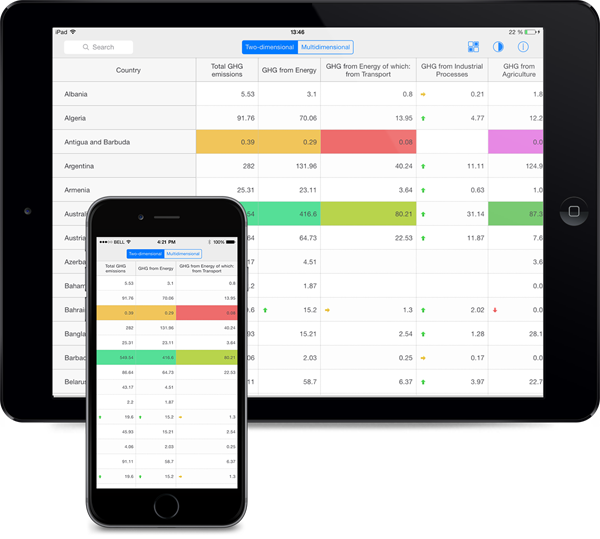
Smart grids, tables & spreadhseets!

Grid, table and spreadsheet framework for your iOS application. Create stunning grids in minutes with NGrid clear API, complete documentation and extreme performance.

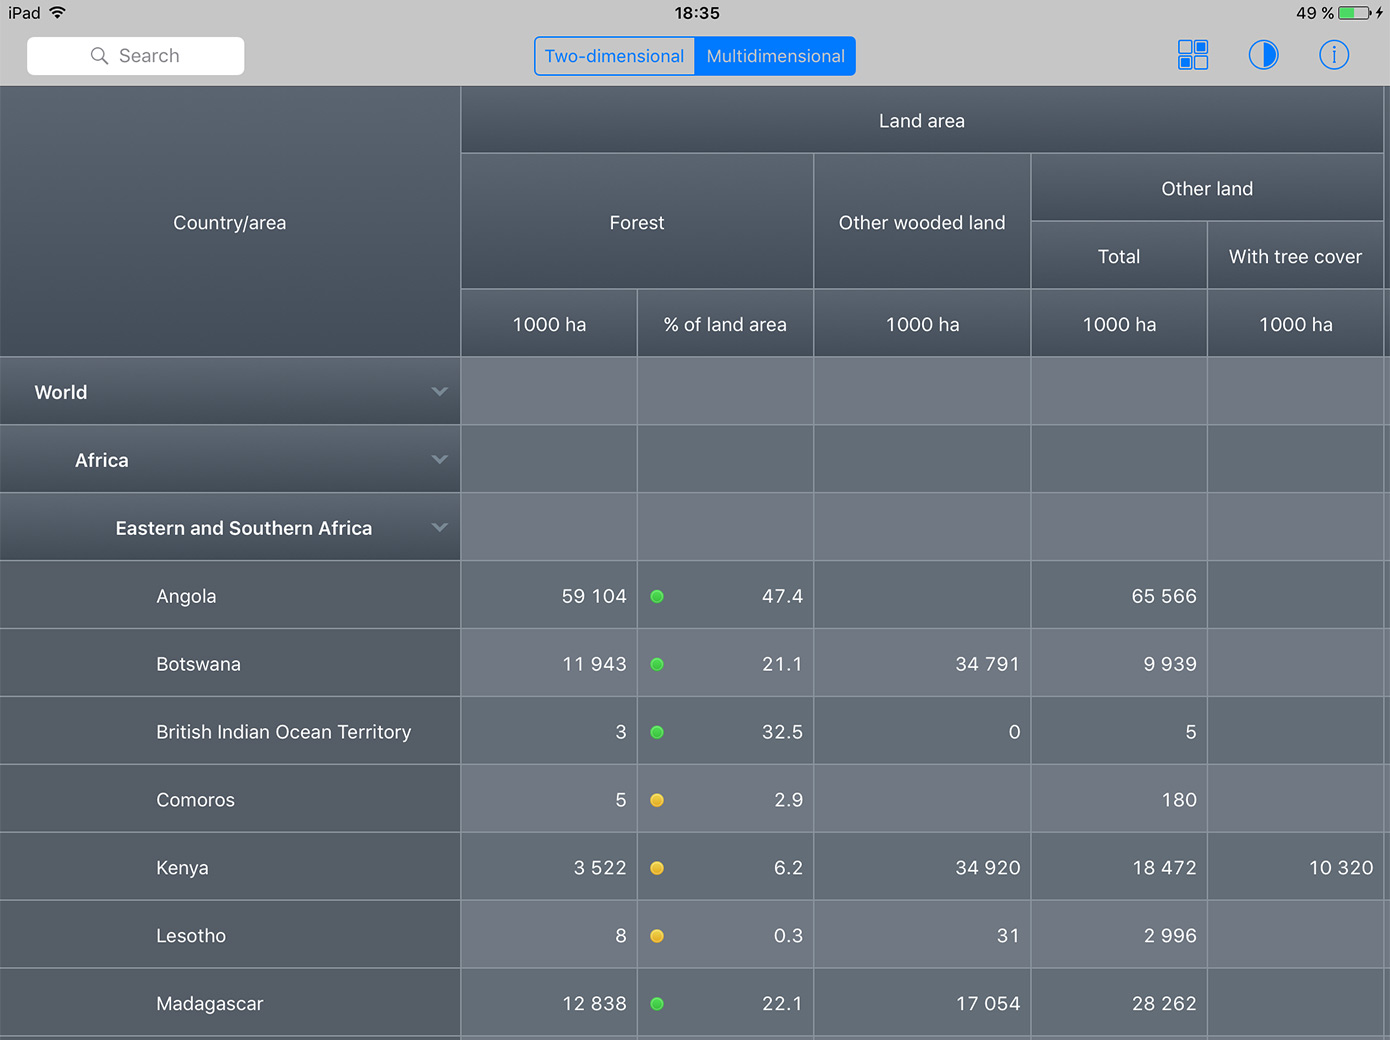
Scaling from a simple table to sophisticated interactive reports with growth indicators and sparklines NGrid is ideal for consumer, business, analytics and science iOS apps.

Demo & TrialBuy now
Buy now

FLEXIBILITY

Simple two-dimensional tables with sort, filtering and analytical functions you can create in few minutes with NGrid framework.
Displaying of multidimensional datasets from OLAP or other datasources.
Awesome reports with tables with much less effort than before. NGrid is optimized for huge datasets and online data.
Automatic cell size adjustment either to fit the rows and columns in the frame the grid is displayed in, or to make entire cells' content visible.
Native Objective-C API, and Swift API.

STYLES

Fine tune the look with style engine. Data, cells and whole table customization is available.

ARCHITECTURE

NGrid follows UIKit patterns. Using NGrid is no harder than UITableView.

DELEGATES

NGrid capabilities are easily extendable by delegating.

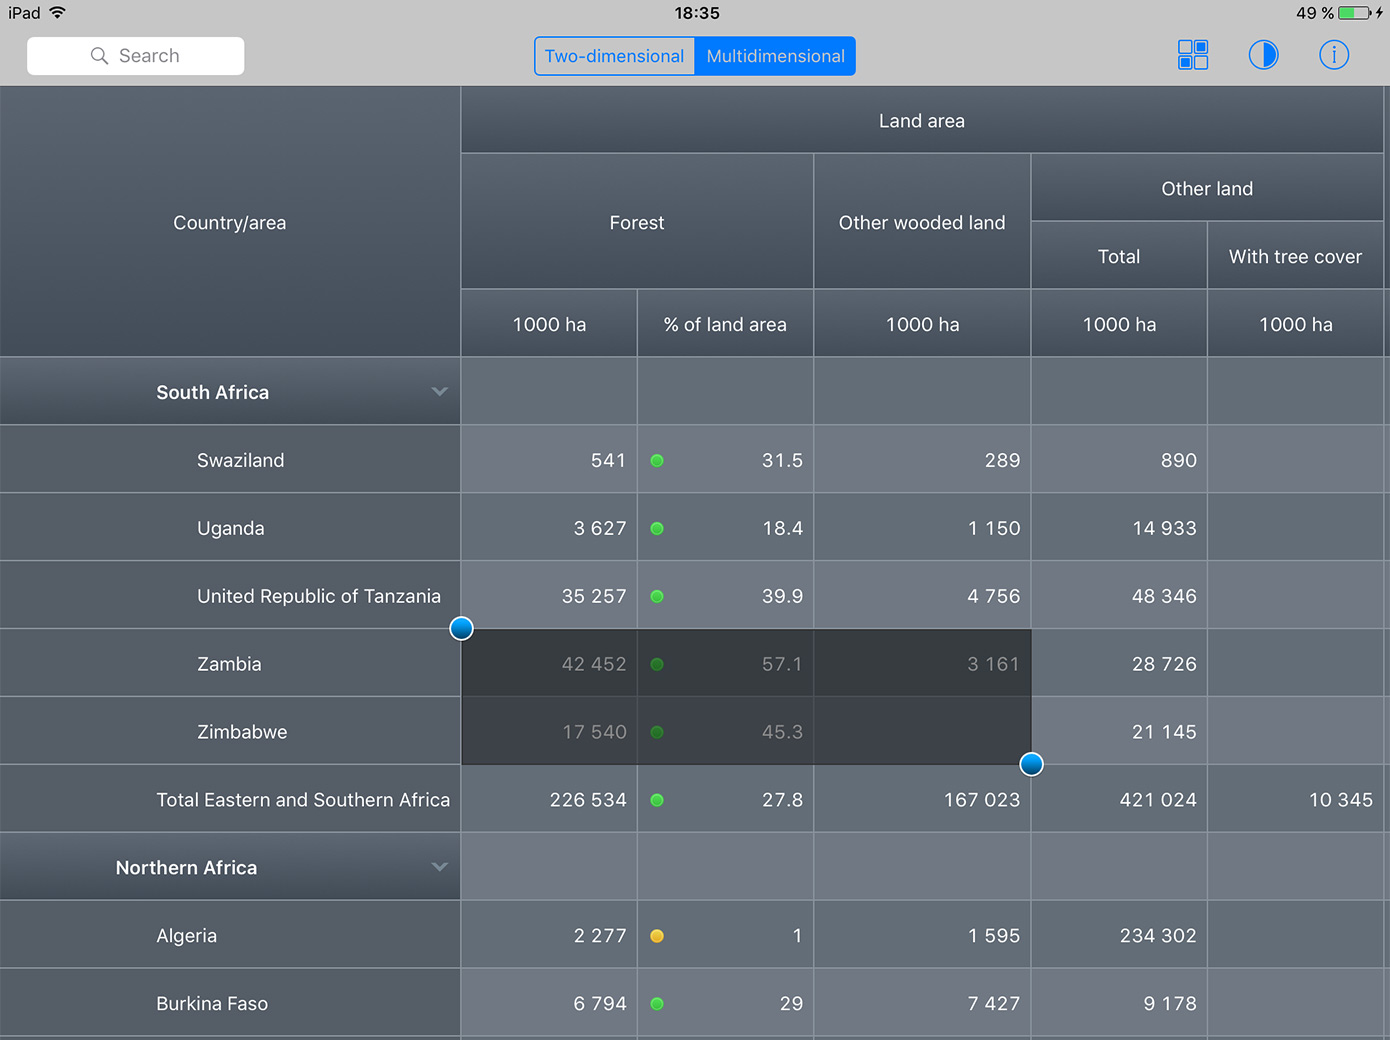
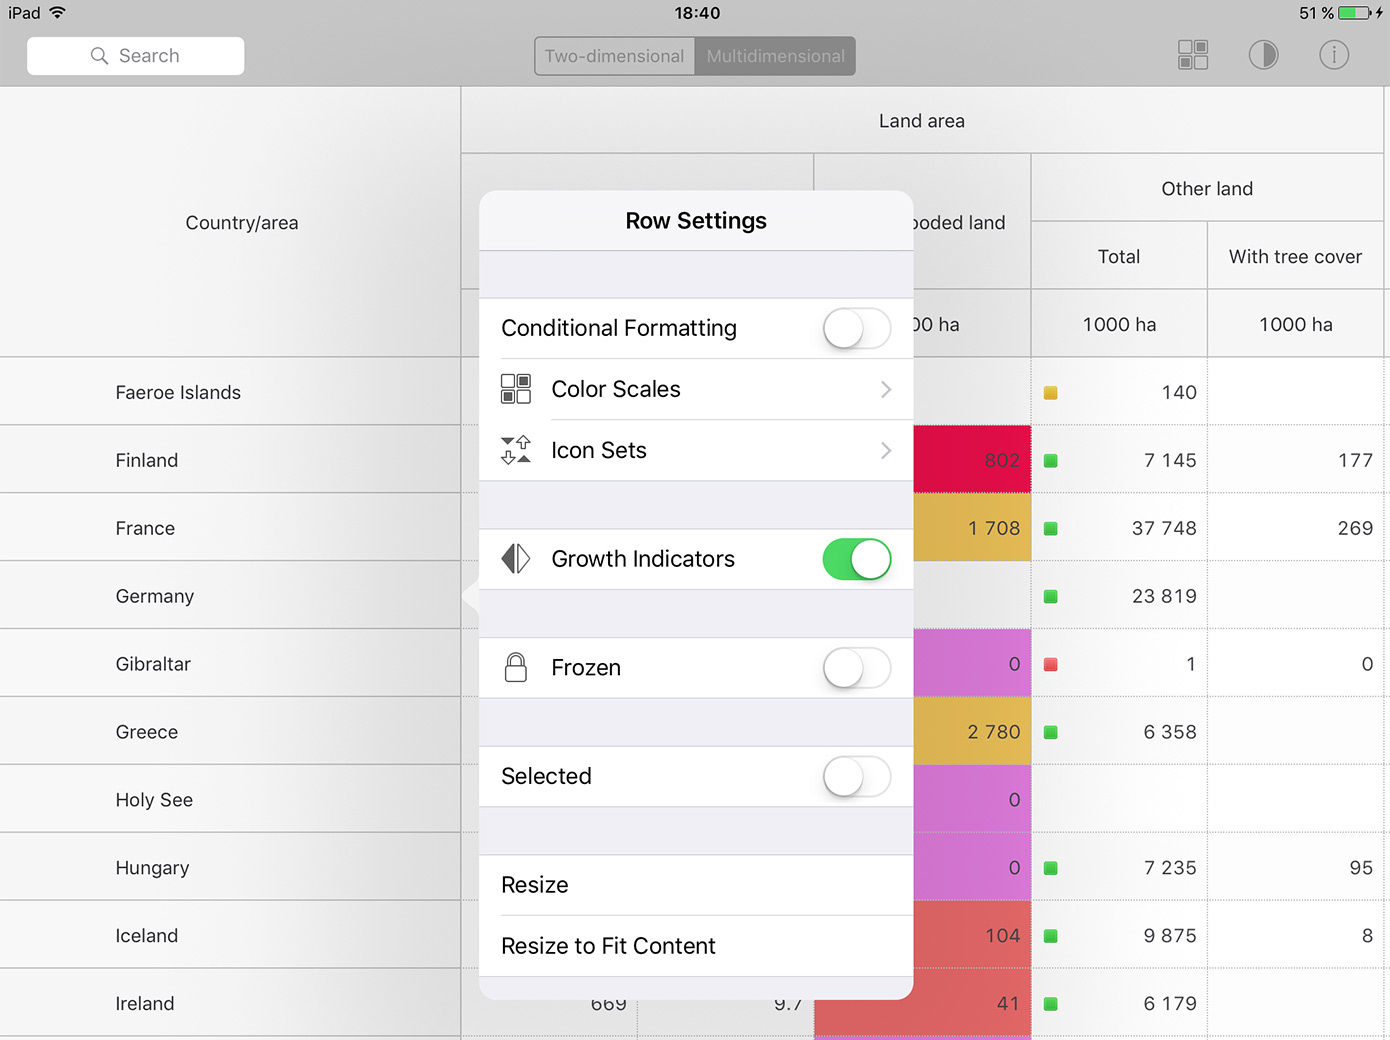
Interaction editing and filtering

Edit data using internal (in-cell) or external editors. You can use default editors or implement your own ones with only a few lines of code.
Freeze, sort and filter rows & columns. The logic is customizable via delegates and proxy data sources.
Select data by long-tap gesture or using API calls. Copying selected data is available out of the box and selection logic is fully customizable.
  • Pinch
  • Scroll
  • Hold
Interaction

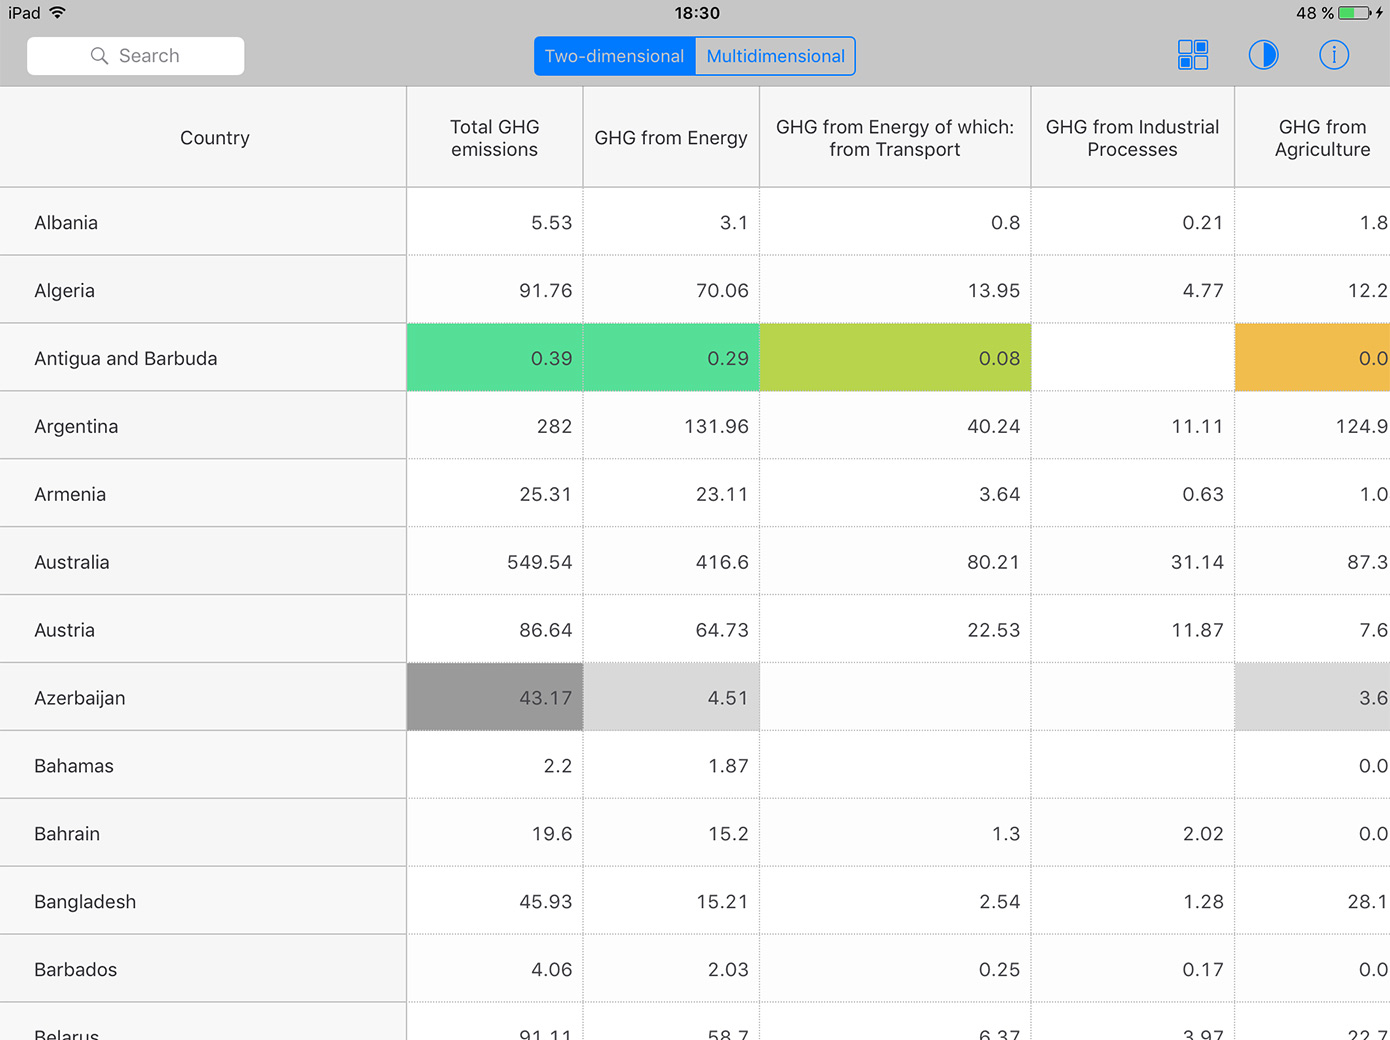
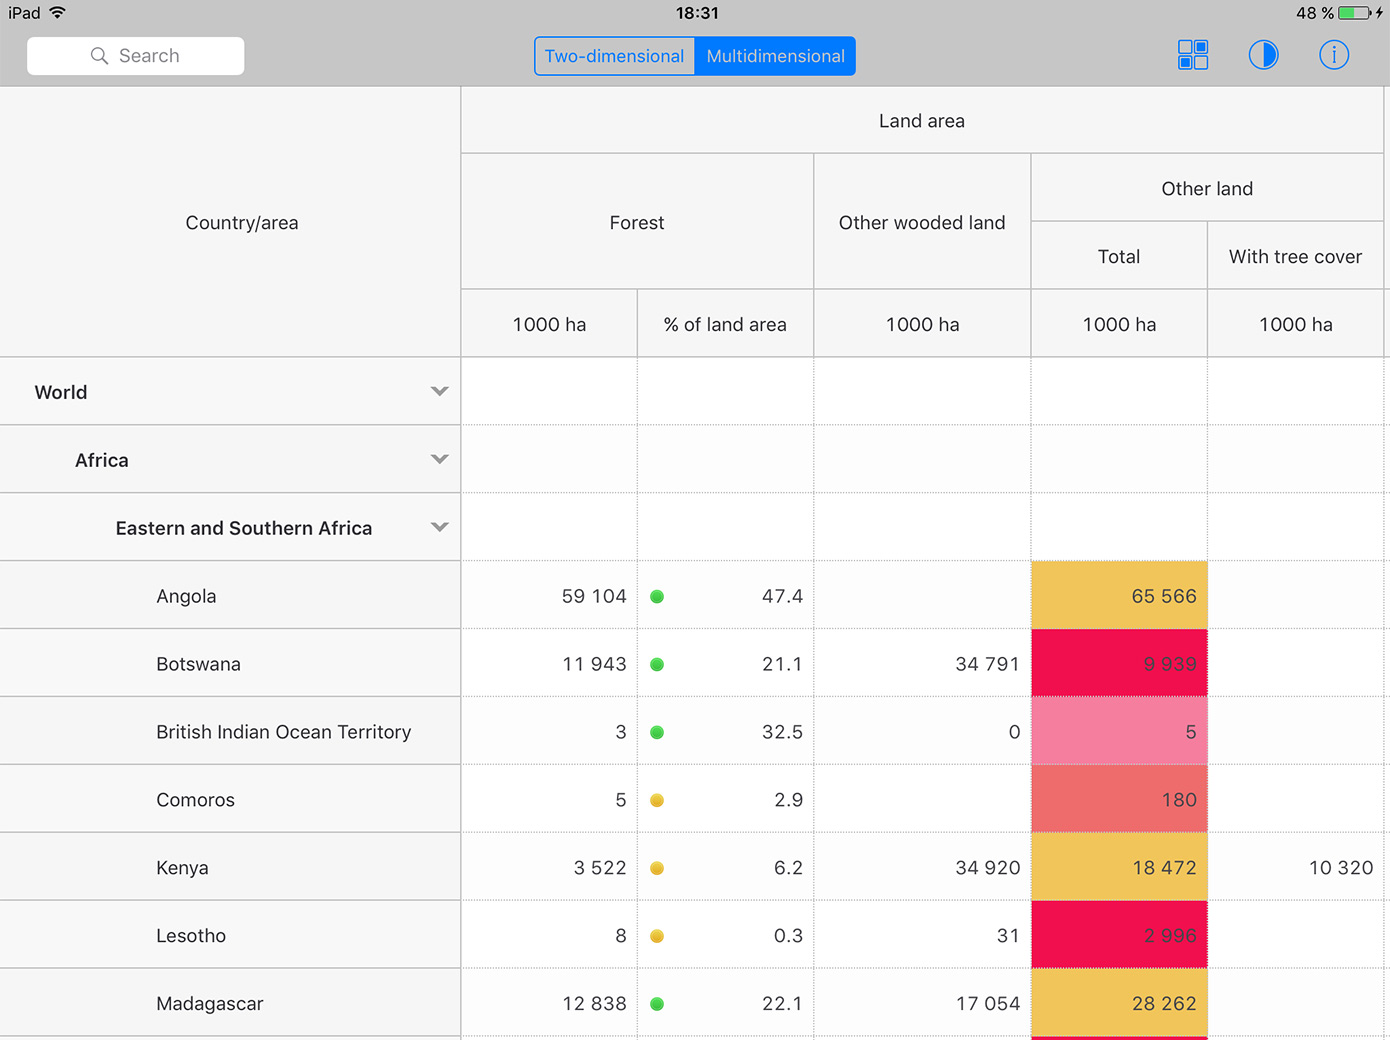
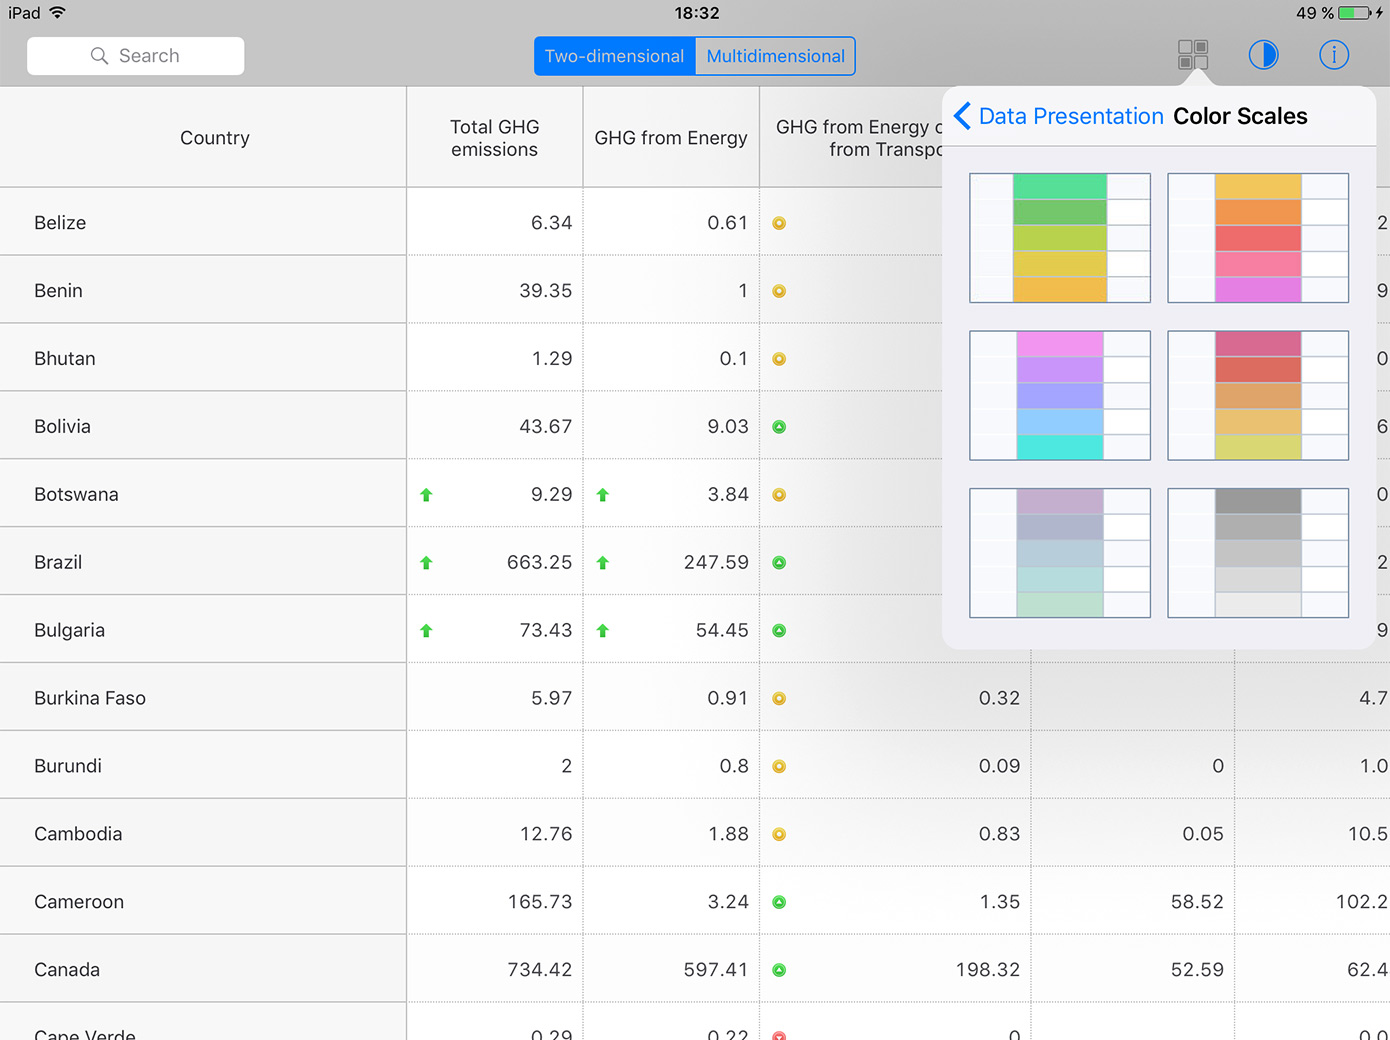
Conditional Formatting

Rich data analysis is available with conditional formatting. Highlight the data with colors or icons or implement your own formatting logic.
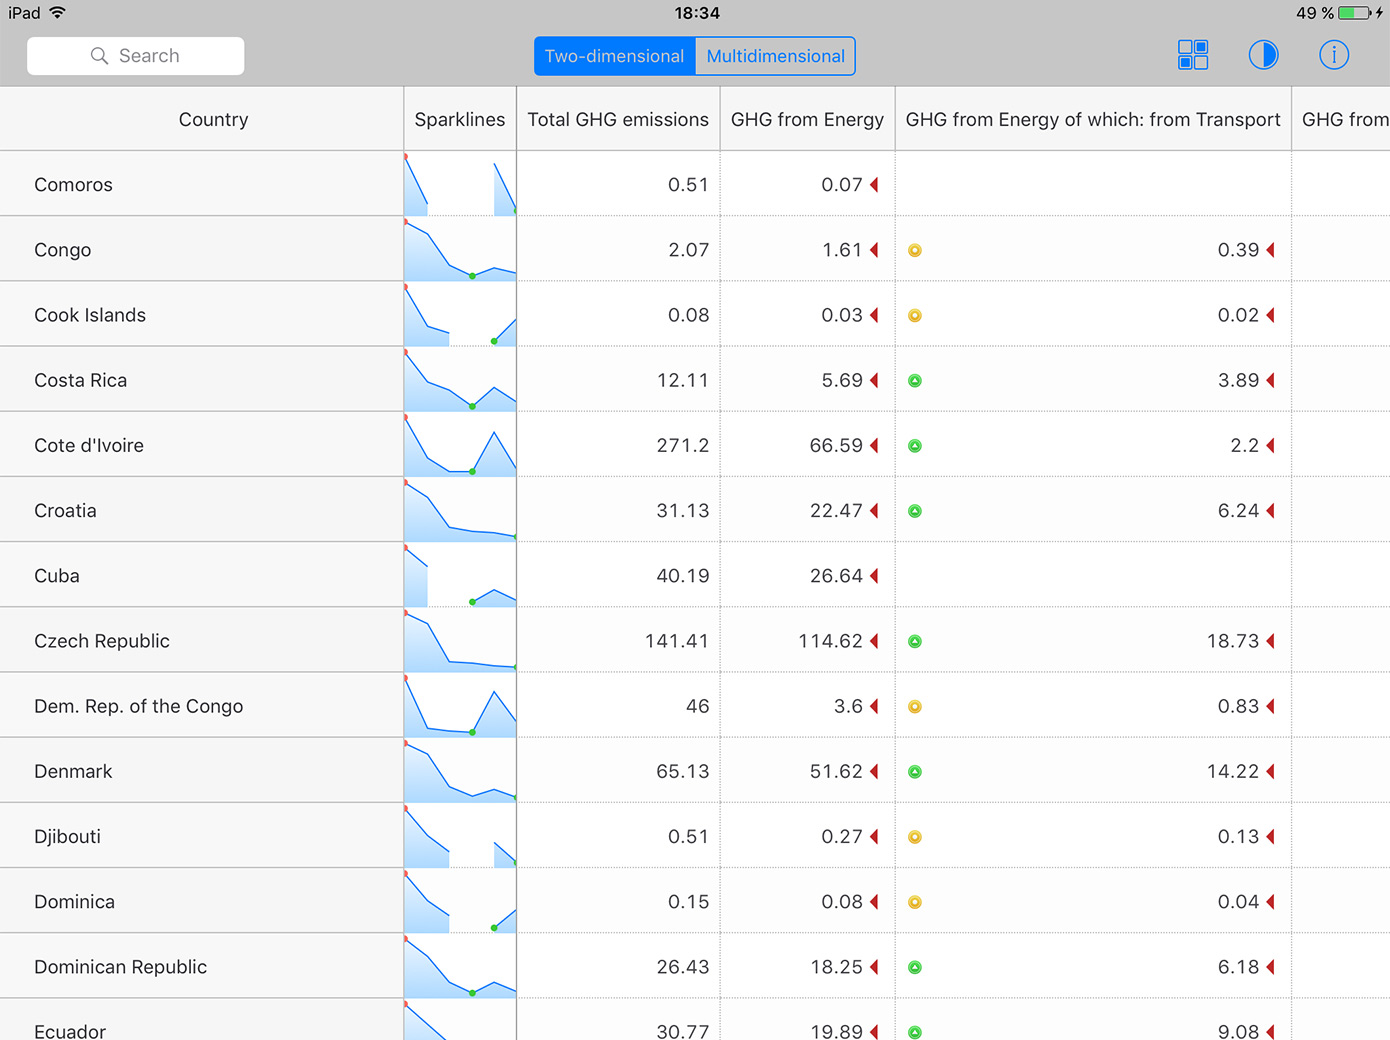
Sparklines

Sparklines are the simple line and area charts in a row or a column. Sparklines are fully customizable by using NGrid styles.
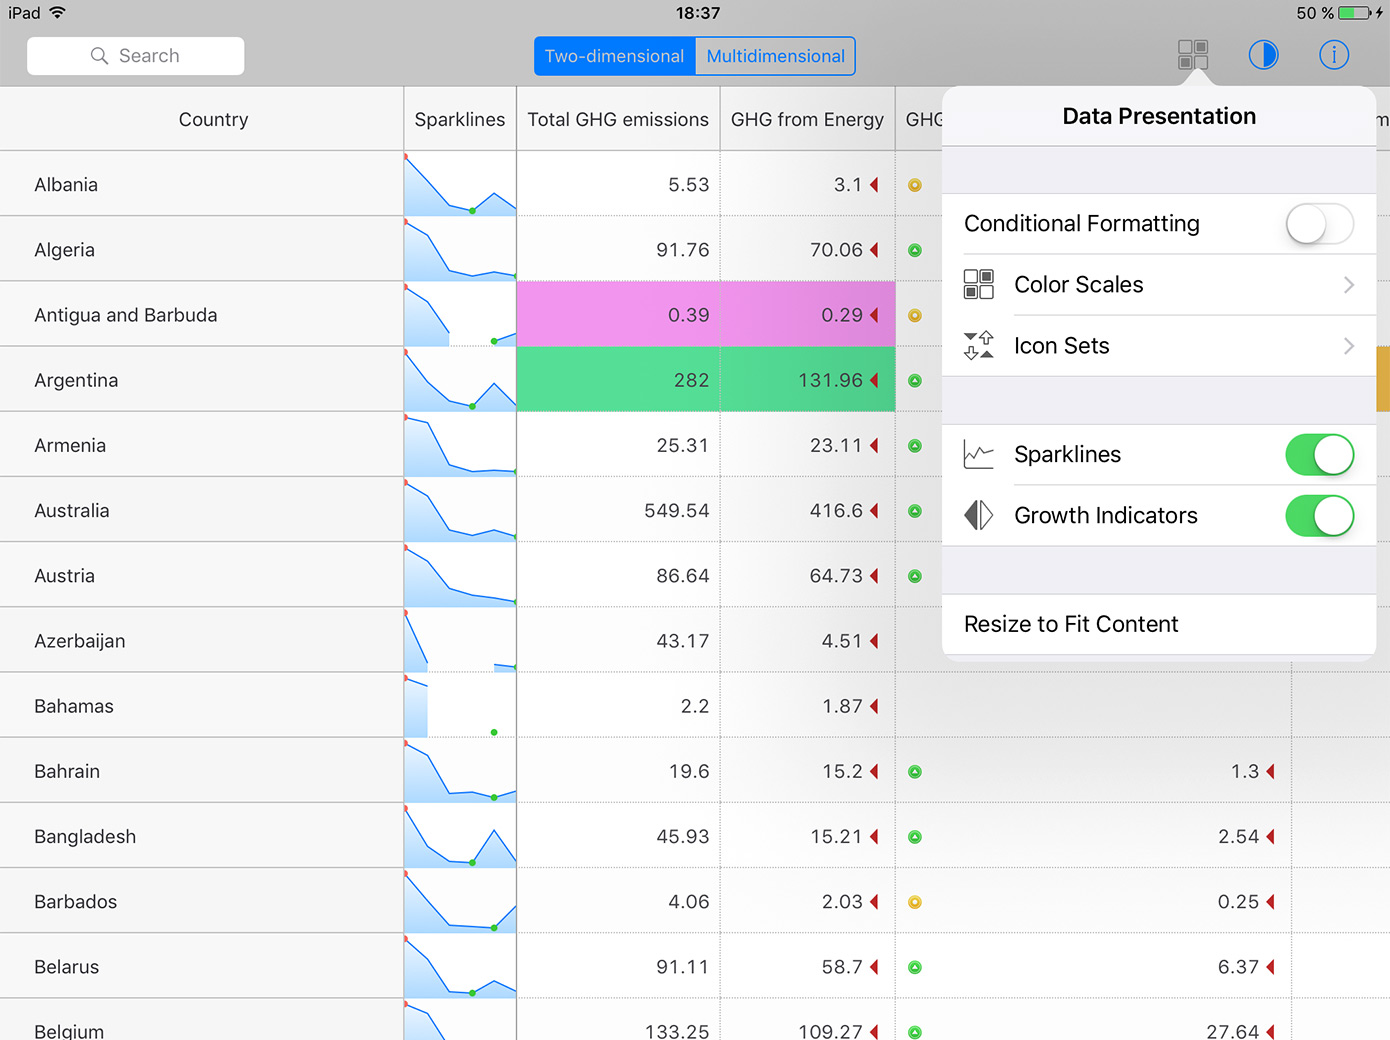
GROWTH INDICATORS

Growth indicators show data dynamics. They are ideal in business and analytical applications.