The NChartCoordSystem class provides basic methods for managing the chart's coordinate system. More...
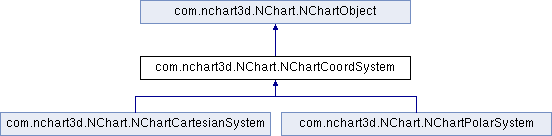
Public Member Functions | |
| abstract NChartMargin | getMargin () |
| Margin of the coordinate system. | |
| abstract void | setMargin (NChartMargin margin) |
| For details see getMargin(). | |
| abstract NChartMargin | getPlotAreaMargin () |
| Fixed margin for the plot area. More... | |
| abstract void | setPlotAreaMargin (NChartMargin plotAreaMargin) |
| For details see getPlotAreaMargin(). | |
Public Member Functions inherited from com.nchart3d.NChart.NChartObject | |
| boolean | isVisible () |
| Flag that determines if the object is visible or not. More... | |
| void | setVisible (boolean visible) |
| For details see isVisible(). | |
| NChart | getChart () |
| Chart the object belongs to. More... | |
Detailed Description
The NChartCoordSystem class provides basic methods for managing the chart's coordinate system.
Member Function Documentation
|
abstract |
Fixed margin for the plot area.
If all the margin values are zero (default), it is ignored and calculated based on the content size: widths and heights of captions, axes labels, etc. But if at least one value is non-zero, this margin overrides the automatically calculated one and is applied regardless of actual sizes of other elements.
You may want to use this property if you want to control the size of the chart plot area. For example, if you have two plots one over another and you want them to have identical length of X axes to be perfectly aligned even though the values on their Y axes are different (have different width and therefore push their plot areas by different amount of space). Setting this property to equal values for both charts will give you a guaranteed perfect alignment, but you'll have then to make sure that all the labels have enough space to be displayed. So, use it carefully.

Public Member Functions inherited from